

SpatialEstimatorFunction
represents a function generated by SpatialEstimate and predicts spatial field values from locations.
Details
- SpatialEstimatorFunction works like Function.
- SpatialEstimatorFunction is generated by SpatialEstimate.
- SpatialEstimatorFunction[…][loc] attempts to predict the value associated with the location loc.
- SpatialEstimatorFunction[…][{loc1,loc2,…}] attempts to predict the values at all the loci.
- SpatialEstimatorFunction[…][loc,"prop"] gives the specified property of the prediction associated with loc.
- Possible properties "prop" include:
-
"Value" the predicted value "Around" the predicted value with uncertainty "StandardDeviation" the standard deviation of the predicted value "Variance" the variance of the predicted value {"prop1","prop2",…} several properties
Examples
open all close allBasic Examples (1)
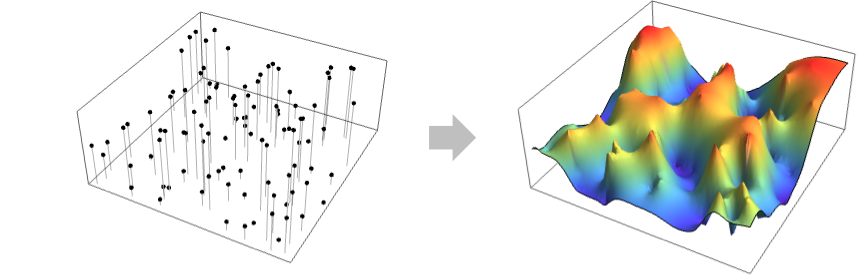
Create SpatialEstimatorFunction for random data:
m = 25;
data = RandomReal[1, {m, 2}] -> RandomReal[1, m];sf = SpatialEstimate[data]Prediction value at a location:
sf[{.3, .1}]sf[{.3, .1}, "Value"]Standard variation of the prediction at a location:
sf[{.3, .1}, "StandardDeviation"]Prediction value with uncertainty at a location:
sf[{.3, .1}, Around]Find prediction values with uncertainty for a few locations at once:
pts = RandomReal[1, {3, 2}];sf[pts, Around]sf[pts, "AroundArray"]sf["Visualization"]Scope (1)
Access information about estimated variogram model:
m = 100;
data = RandomReal[1, {m, 2}] -> RandomReal[1, m];sf = SpatialEstimate[data]Estimated VariogramModel:
sf["VariogramModel"]BinnedVariogramList computed from the data:
sf["VariogramModel"]["BinnedVariogramList"]Applications (1)
Ozone readings over the contiguous United States:
locs = GeoPosition[{{25.5, -124.5}, {25.5, -123.5}, {25.5, -122.5}, {25.5, -121.5}, {25.5, -120.5},
  {25.5, -112.5}, {25.5, -111.5}, {25.5, -110.5}, {25.5, -109.5}, {25.5, -108.5}, {25.5, -107.5},
  {25.5, -106.5}, {25.5, -105.5}, {25.5, -104.5}, {25.5 ... 8.5, -87.5}, {48.5, -86.5},
  {48.5, -85.5}, {48.5, -84.5}, {48.5, -83.5}, {48.5, -82.5}, {48.5, -81.5}, {48.5, -80.5},
  {48.5, -79.5}, {48.5, -78.5}, {48.5, -72.5}, {48.5, -71.5}, {48.5, -70.5}, {48.5, -69.5},
{48.5, -68.5}, {48.5, -67.5}}];ozone = {...};PointValuePlot[locs -> ozone, ColorFunction -> "Rainbow"]sf = SpatialEstimate[locs -> ozone]Find the estimated ozone value for specific locations:
cities = {Entity["City", {"Boston", "Massachusetts", "UnitedStates"}], Entity["City", {"Chicago", "Illinois", "UnitedStates"}], Entity["City", {"Detroit", "Michigan", "UnitedStates"}], Entity["City", {"Houston", "Texas", "UnitedStates"}]};Map[# -> sf[#]&, cities]Text
Wolfram Research (2021), SpatialEstimatorFunction, Wolfram Language function, https://reference.wolfram.com/language/ref/SpatialEstimatorFunction.html.
CMS
Wolfram Language. 2021. "SpatialEstimatorFunction." Wolfram Language & System Documentation Center. Wolfram Research. https://reference.wolfram.com/language/ref/SpatialEstimatorFunction.html.
APA
Wolfram Language. (2021). SpatialEstimatorFunction. Wolfram Language & System Documentation Center. Retrieved from https://reference.wolfram.com/language/ref/SpatialEstimatorFunction.html