

VectorPoints
is an option to VectorPlot, ListVectorPlot, and related functions that determines where to draw arrows.
Details
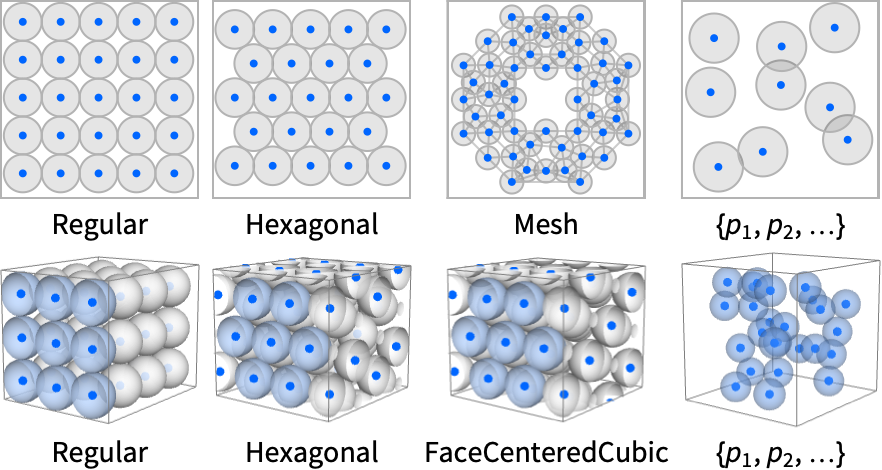
- Typical point patterns used for drawing arrows.
- The following settings can be given for VectorPoints:
-
None draw no arrows Automatic draw automatically selected arrows n use upto n points in each direction {m,n}, {m,n,k} use a grid of arrows in 2D or 3D Coarse automatically chosen coarse set of arrows Fine automatically chosen fine set of arrows "name" use the named setting {"name",n} use the named settings with a given number of points {p1,p2,…} draw arrows at the points p1, p2, … {{p1,g1},…} draw the arrow at p1 using graphics directive g1 - The following are named settings:
-
"Regular" draw arrows on a regular grid "Hexagonal" draw arrows on a 2D or 3D hexagonal grid "Mesh" draw arrows on a 2D discretized mesh "FaceCenteredCubic" draw arrows on a 3D face-centered cubic grid
Examples
open all close allBasic Examples (5)
Plot a vector field with arrows on a hexagonal grid:
VectorPlot[{-1 - x ^ 2 + y, 1 + x - y ^ 2}, {x, -3, 3}, {y, -3, 3}, VectorPoints -> {7, 9}]Use coarse and fine settings for the vector density:
{VectorPlot[{x + y, -x + y}, {x, -3, 3}, {y, -3, 3}, VectorPoints -> #]& /@ {Coarse, Fine}}Specify a list of points for showing field vectors:
VectorPlot[{-1 - x ^ 2 + y, 1 + x - y ^ 2}, {x, -3, 3}, {y, -3, 3}, VectorPoints -> RandomReal[{-3, 3}, {300, 2}], VectorSizes -> 2]"Mesh" generates points based on a partition of the domain:
VectorPlot[{y - x(1 - x^2 - y^2)^2, -x - y(1 - x^2 - y^2)^2}, {x, -3, 3}, {y, -3, 3}, VectorPoints -> "Mesh"]"Mesh" samples the boundary of the region:
VectorPlot[{y - x(1 - x^2 - y^2)^2, -x - y(1 - x^2 - y^2)^2}, {x, -3, 3}, {y, -3, 3}, VectorPoints -> "Mesh", RegionFunction -> Function[{x, y, fx, fy, n}, x^2 + y^2 ≤ 4]]VectorPlot[{y - x(1 - x^2 - y^2)^2, -x - y(1 - x^2 - y^2)^2}, {x, -3, 3}, {y, -3, 3}, VectorPoints -> "Mesh", RegionFunction -> Function[{x, y, fx, fy, n}, Abs[x] + Abs[y] > 2]]Scope (2)
Use a different number of field vectors on a hexagonal grid:
Grid[Partition[Table[VectorPlot[{y ^ 2, x ^ 2 - y ^ 2}, {x, -3, 3}, {y, -3, 3}, VectorPoints -> n], {n, 5, 20, 5}], 2]]The location for vectors is given in the middle of the drawn vector:
points = {{-1, -1}, {-1, 1}, {0, 0}, {1, -1}, {1, 1}};VectorPlot[{-1 - x ^ 2 + y, 1 + x - y ^ 2}, {x, -2, 2}, {y, -2, 2}, VectorPoints -> points, Epilog -> {Red, PointSize[Medium], Point[points]}]Possible Issues (1)
The default hexagonal mesh can introduce a hexagonal artifact:
VectorPlot[{y - x(1 - x^2 - y^2)^2, -x - y(1 - x^2 - y^2)^2}, {x, -3, 3}, {y, -3, 3}, VectorPoints -> 25]Eliminate the hexagonal artifact by using a different method of point generation:
VectorPlot[{y - x(1 - x^2 - y^2)^2, -x - y(1 - x^2 - y^2)^2}, {x, -3, 3}, {y, -3, 3}, VectorPoints -> {"Mesh", 25}]Text
Wolfram Research (2008), VectorPoints, Wolfram Language function, https://reference.wolfram.com/language/ref/VectorPoints.html (updated 2020).
CMS
Wolfram Language. 2008. "VectorPoints." Wolfram Language & System Documentation Center. Wolfram Research. Last Modified 2020. https://reference.wolfram.com/language/ref/VectorPoints.html.
APA
Wolfram Language. (2008). VectorPoints. Wolfram Language & System Documentation Center. Retrieved from https://reference.wolfram.com/language/ref/VectorPoints.html