"TSNE" (Machine Learning Method)
- Method for DimensionReduction, DimensionReduce, FeatureSpacePlot and FeatureSpacePlot3D.
- Reduce the dimension of data using t-distributed stochastic neighbor embedding.
Details & Suboptions
- "TSNE", which stands for t-distributed stochastic neighbor embedding, is a nonlinear non-parametric dimensionality reduction method. The method attempts to learn a low-dimensional representation of the data that preserves the local structure of the data.
- "TSNE" works for datasets with nonlinear manifolds and is particularly suited for the visualization of high-dimensional datasets; however, it is slow to train for datasets that have a large number of features and large number of examples.
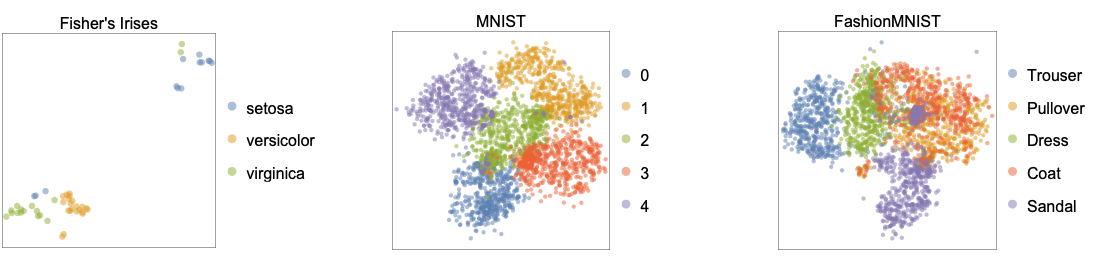
- The following shows two-dimensional embeddings learned by the "TSNE" method applied to the benchmark datasets Fisher's Irises, MNIST and FashionMNIST:
- Given the similarity matrix
") of data points (xi, xj) in the original space, "TSNE" attempts to find the lower-dimensional embeddings
of data points (xi, xj) in the original space, "TSNE" attempts to find the lower-dimensional embeddings  , such that similarities
 ") in the lower-dimensional space match
in the lower-dimensional space match ") .
. - Similarities in the original space are given by
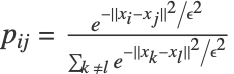 , where
  corresponds to a neighborhood radius. Similarities in the lower-dimensional space are given by
 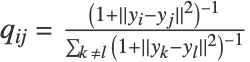 .
. - The lower-dimensional embeddings
 are computed by minimizing the embedding cost
 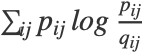 .
. - The parameter
 is indirectly controlled by a perplexity parameter. A large perplexity results in a small amount of clusters while small perplexity leads to many clusters.
 - The following suboptions can be given:
-
"Perplexity" Automatic radius ϵ "LinearPrereduction" False whether to perform a linear reduction before running the t-SNE method
Examples
open all close allBasic Examples (1)
Reduce the dimension of some images using the "TSNE" method:
fmnist = {[image], [image], [image], [image], [image], [image], [image], [image], [image], [image], [image], [image], [image], [image], [image], [image], [image], [image], [image], [image], [image], [image], [image], [image], [image], [image], [image], [image], [image], [image], [image], [image], [image], [image], [image], [image], [image], [image], [image], [image], [image], [image], [image], [image], [image], [image], [image], [image], [image], [image], [image], [image], [image], [image], [image], [image], [image], [image], [image], [image], [image], [image], [image], [image], [image], [image], [image], [image], [image], [image], [image], [image], [image], [image], [image], [image], [image], [image], [image], [image], [image], [image], [image], [image], [image], [image], [image], [image], [image], [image], [image], [image], [image], [image], [image], [image], [image], [image], [image], [image]};
reduced = DimensionReduce[fmnist, 2, Method -> "TSNE"];
Visualize the two-dimensional representation of images:
ListPlot[MapThread[Labeled[#1, #2]&, {reduced, fmnist}], ...]Options (2)
"Perplexity" (1)
Load the Fisher Iris dataset from ExampleData:
iris = ExampleData[{"MachineLearning", "FisherIris"}, "Data"];RandomSample[iris, 5]Generate a reducer function using the "TSNE" method:
diris = DimensionReduction[iris[[All, 1]], 2, Method -> "TSNE"]Group the examples by their species:
byspecies = GroupBy[iris, Last -> First];Reduce the dimension of the features:
byspecies = diris /@ byspecies;Visualize the reduced dataset:
ListPlot[Values[byspecies], PlotLegends -> Keys[byspecies]]Perform the same operation using a different perplexity value:
diris = DimensionReduction[iris[[All, 1]], 2, Method -> {"TSNE", "Perplexity" -> 100}]byspecies = GroupBy[iris, Last -> First];
byspecies = diris /@ byspecies;
ListPlot[Values[byspecies], PlotLegends -> Keys[byspecies]]"LinearPrereduction" (1)
Load a sample from the "MNIST" dataset:
mnist = RandomSample[ResourceData["MNIST"][[All, 1]], 200];Reduce the dimension of images using "TSNE":
features = DimensionReduce[mnist, Method -> "TSNE"];Find features by performing a linear reduction before running the t-SNE method using the "LinearPrereduction" suboption:
features2 = DimensionReduce[mnist, Method -> {"TSNE", "LinearPrereduction" -> True}];Visualize the obtained features and compare the results:
ListPlot[List /@ features, ...]
ListPlot[List /@ features2, ...]
Applications (1)
Data Visualization (1)
Reduce the dimension of some images using the "TSNE" method:
flowers = {[image], [image], [image], [image], [image], [image], [image], [image], [image], [image], [image], [image], [image], [image], [image], [image], [image], [image], [image], [image], [image]};
reduced = DimensionReduce[flowers, 2, Method -> {"TSNE", "LinearPrereduction" -> True}];
Visualize the two-dimensional representation of images:
ListPlot[MapThread[Labeled[#1, #2]&, {reduced, flowers}]]