

DecisionTreeModel
represents an untrained decision tree.
DecisionTreeModel[hpars]
uses the custom hyperparameters hpars.
DecisionTreeModel[hpars,vars]
use the provided variables vars.
Details
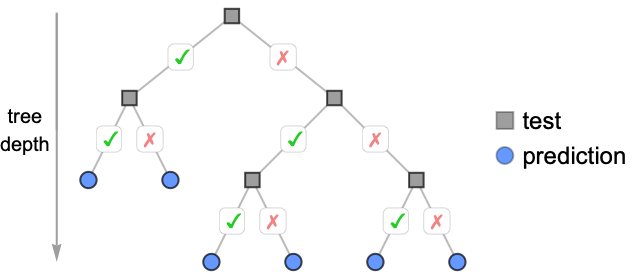
- DecisionTreeModel models a classification or regression task as a sequence of binary choices based on a single input feature.
- Decision trees are typically used with mixed-type data (categorical and numerical) to model nonlinear relationships and multiclass problems.
- In a decision tree, each internal node represents a test and each leaf a final value.
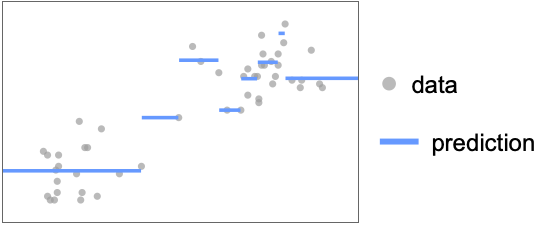
- Decision tree predictions are, in general, not continuous.
- The following hyperparameters may be specified to control the decision tree:
-
"MaxDepth" 10 maximum number of splits per branch "MinGain" Scaled[0.01] minimal gain to keep a split "MinLeafSamples" 1 minimal number of samples per leaf node "MinSamples" 5 minimal number of samples to consider a split - Splits are evaluated by the model loss: the root mean square error for regression and the Gini index for classification.
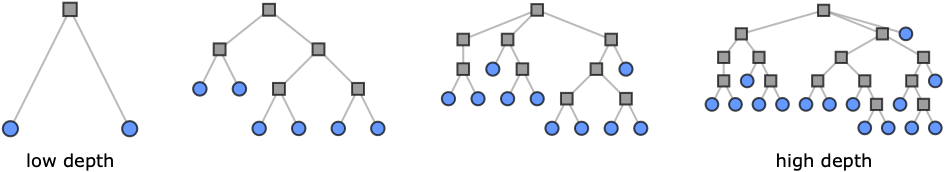
- "MaxDepth" controls model complexity: large values yield deeper trees prone to overfitting; small values yield shallower trees that may underfit.
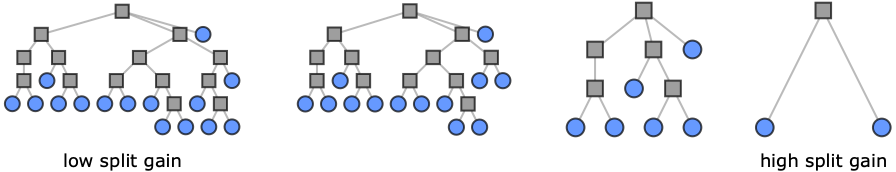
- A split is kept only if it reduces the loss by at least "MinGain". With "MinGain" Scaled[f], the threshold is f times the loss of the node being split rather than an absolute value.
- "MinSamples" is the minimum sample count required for a node to be considered for splitting; "MinLeafSamples" is the minimum each resulting child must contain for a split to be accepted.
Lower values produce finer splits at the cost of more noise. - When not specified, variables will automatically be enumerated using x[i].
- Valid variable specifications vars include:
-
n the number of variables symb a symbolic representation of a single variable {symb1,…} a list of symbolic variables - Model properties can be extracted using Information[PowerModel[…],prop].
- Valid basic properties include:
-
"BaseType" model base type "Name" model name "ShortName" short identifier to use as label "InputType" supported input types "OutputType" supported output types - Valid data-related properties include:
-
"ColumnNames" names of the input features "ColumnVariableMap" map between column names and model variables "InputSize" dimensionality of the input "OutputSize" dimensionality of the output "Trainable" whether the model is fully specified and can be trained "Trained" whether the model can be evaluated numerically "VariableColumnMap" map between model variables and column names "Variables" name of the model variables - Best model-related properties include:
-
"Expression" model expression "Function" model as a pure function "SymbolicExpression" model expression with symbolic parameters "TabularFunction" pure function suitable to work on a tabular row - Parameter-related properties include:
-
"Parameters" parameter values if present; names otherwise "ParameterValues" parameter values - Hyperparameter-related properties include:
-
"HyperparameterDefaultDomain" default hyperparameter search domain "HyperparameterDomain" specified hyperparameter search domain "Hyperparameters" hyperparameter values
Hyperparameters
Variables
Properties
Examples
open all close allBasic Examples (3)
Create a generic decision tree model:
DecisionTreeModel[]Specify multiple custom hyperparameters:
DecisionTreeModel[<|"MaxDepth" -> 20, "MinSamples" -> 7|>]Train a decision tree classifier on the Fisher Iris dataset:
model = ModelFit[ResourceData["Sample Tabular Data: Fisher Iris"] -> "Species", DecisionTreeModel[]]Information[model, "Tree"]Scope (22)
Hyperparameters (8)
"MaxDepth" (2)
Define a tree with default "MaxDepth" value:
DecisionTreeModel[]DecisionTreeModel["MaxDepth" -> 3]The tree depth controls how many times the input space is subdivided:
data = {...};modelDefault = ModelFit[data, DecisionTreeModel[]]Information[modelDefault, "Tree"]Reduce "MaxDepth" to prevent overfitting:
model = ModelFit[data, DecisionTreeModel["MaxDepth" -> 3]]Information[model, "Tree"]Plot[{modelDefault[x], model[x]}, {x, 0, 100}, PlotLabels -> {"Default", "MaxDepth" -> 3}, Exclusions -> None, PlotLayout -> "Row", Prolog -> Point[data]]"MinGain" (3)
Specify the minimal gain of a split:
data = Sin[Range[100] / 10.];
model = ModelFit[data, DecisionTreeModel["MinGain" -> .1]]ListPlot[data, PlotFit -> model]Use zero gain to avoid any gain-based regularization:
data = Sin[Range[100] / 10.];
model = ModelFit[data, DecisionTreeModel["MinGain" -> 0]]ListPlot[data, PlotFit -> model]Find the best value of "MinGain" through cross-validation:
model = ModelFit[Sin[Range[100] / 10.], DecisionTreeModel["MinGain" -> 0. | 0.01 | .1 | .5]]Information[model, "Hyperparameters"]"MinLeafSamples" (2)
Specify the minimal number of examples on every tree leaf:
ModelFit[{...}, DecisionTreeModel["MinLeafSamples" -> 20]]Information[%, "Tree"]Allow nodes to have a single example:
ModelFit[{...}, DecisionTreeModel["MinLeafSamples" -> 1]]Information[%, "Tree"]"MinSamples" (1)
Specify the minimal number of example required to split a node:
data = {...};model10 = ModelFit[data, DecisionTreeModel["MinSamples" -> 10]]Information[model10, "Tree"]Using lower values results in a bushier tree with more leaves and risks overfitting:
model2 = ModelFit[data, DecisionTreeModel["MinSamples" -> 2]]Information[model2, "Tree"]PlotGrid[{{ListPlot[data, PlotFit -> model10],
ListPlot[data, PlotFit -> model2]}}]Variables (3)
Define a tree with a specific number of variables:
DecisionTreeModel[Automatic, 2]DecisionTreeModel[Automatic, {x, y, z}]ModelFit will assume the number of variables is one less than the dimensionality of data points:
ModelFit[{{1, 9, 55}, {1, 1, 7}, {1, 4, 25}, {8, 9, 118}, {8, 10, 124}, {8, 5, 94}}, DecisionTreeModel[]]Evaluation (4)
Evaluate a trained decision tree model numerically:
ModelFit[{...}, DecisionTreeModel[]][{1, 2}]Evaluate a trained decision tree model symbolically:
ModelFit[{...}, DecisionTreeModel[]][{x, y}]Evaluate decision tree model on a list of inputs:
ModelFit[{...}, DecisionTreeModel[]][{{1.17841, 7.0408}, {7.8774, 3.20304}, {5.12858, 7.89375}}]Untrained decision trees cannot be evaluated symbolically:
DecisionTreeModel[2, 1][x]Information (5)
View general information about a model:
Information[DecisionTreeModel[]]Some information is only available when variables or parameters are fully specified:
Information[DecisionTreeModel[Association["Hyperparameters" -> Association["MaxDepth" -> 10, "MinSamples" -> 5,
    "MinLeafSamples" -> 1, "MinGain" -> 0.01]],
 Association["ParameterValues" -> Association["Feature" -> 1, "Threshold" -> 4, "Gain" -> 1722.25,
    "Size" -> 6, "FeatureType" -> "Numerical", "Left" -> Association["Value" -> Around[29., 14.],
      "Size" -> 3], "Right" -> Association["Value" -> Around[112., 9.16515138991168],
"Size" -> 3]]], Association["Variables" -> {x}]]]Information[DecisionTreeModel[Association["Hyperparameters" -> Association["MaxDepth" -> 10, "MinSamples" -> 5,
"MinLeafSamples" -> 1, "MinGain" -> 0.01]],
Association["ParameterValues" -> Association["Feature" -> 1, "Threshold" -> 4, "Gain" -> 1722.25,
"Size" -> 6, "FeatureType" -> "Numerical", "Left" -> Association["Value" -> Around[29., 14.],
"Size" -> 3], "Right" -> Association["Value" -> Around[112., 9.16515138991168],
"Size" -> 3]]], Association["Variables" -> {x}]], "Variables"]Information[DecisionTreeModel[Association["Hyperparameters" -> Association["MaxDepth" -> 10, "MinSamples" -> 5,
"MinLeafSamples" -> 1, "MinGain" -> 0.01]],
Association["ParameterValues" -> Association["Feature" -> 1, "Threshold" -> 4, "Gain" -> 1722.25,
"Size" -> 6, "FeatureType" -> "Numerical", "Left" -> Association["Value" -> Around[29., 14.],
"Size" -> 3], "Right" -> Association["Value" -> Around[112., 9.16515138991168],
"Size" -> 3]]], Association["Variables" -> {x}]], {"Variables", "Hyperparameters"}]Get information about the default model values:
Information[DecisionTreeModel[Automatic, 2], {"Variables", "Hyperparameters"}]Fitting (2)
Fit a decision tree model with the default hyperparameters:
ModelFit[{...}, DecisionTreeModel[]]report = ModelFit[{...}, DecisionTreeModel["MaxDepth" -> 0 ;; 5], "Report"]Compare the choice of hyperparameter values via cross-validation:
report["CrossValidationChart"]Applications (4)
Basic Uses (1)
Data Modeling (3)
Retrieve data on the survival of passengers on the Titanic:
titanicData = ResourceData["Sample Tabular Data: Titanic"]Use a highly regularized decision tree model to understand the best predictors of survival:
model = ModelFit[titanicData, DecisionTreeModel[<|"MinGain" -> .1|>]]Information[model, "Tree"]Retrieve data that falls into multiple distinct distributions:
data = ResourceData["Sample Data: Old Faithful Eruptions"];ListPlot[data]Use a decision tree to predict the most likely duration based on the waiting time:
model = ModelFit[data -> "WaitingTime", DecisionTreeModel[]]Show[
ListPlot[data],
Plot[model[x], {x, Quantity[1, "Minutes"], Quantity[5, "Minutes"]}]
]Increase the value of "MinLeafSamples" to avoid overfitting the noise within each section:
modelRegularized = ModelFit[data -> "WaitingTime", DecisionTreeModel[<|"MinLeafSamples" -> 30|>]]Show[
ListPlot[data],
Plot[modelRegularized[x], {x, Quantity[1, "Minutes"], Quantity[5, "Minutes"]}]
]Retrieve data from the Fisher Iris dataset:
data = ResourceData["Sample Tabular Data: Fisher Iris"]Use a decision tree to classify the species according sepal and petal dimensions:
model = ModelFit[data -> "Species", DecisionTreeModel[]]Union@Cases[Information[model, "TabularFunction"], Slot[name_] :> name, All]Only the "PetalLength" and "PetalWidth" are used as predictors. Plot the data in that space:
petalData = GroupBy[data, #"Species"&, KeyTake[{"PetalWidth", "PetalLength"}]];ListPlot[Normal /@ petalData, AxesLabel -> {"Width", "Length"}]Compute the model prediction on a grid in the petal space:
predictions = Table[model[<|"PetalWidth" -> Quantity[w, "Centimeters"], "PetalLength" -> Quantity[l, "Centimeters"], "SepalWidth" -> Quantity[1, "Centimeters"], "SepalLength" -> Quantity[1, "Centimeters"]|>], {w, 0, 2.5, .1}, {l, 0, 7, .2}];Pick a color scheme for the classes:
colors = {"setosa" -> Opacity[0.2, RGBColor[0.4, 0.6, 1]], "versicolor" -> Opacity[0.2, RGBColor[0.98, 0.56, 0.17]], "virginica" -> Opacity[0.2, RGBColor[0.14, 0.8, 0.14]]};Visualize how the model segregates the space by species:
regions = ArrayPlot[Replace[predictions, colors, {2}], ...]Compare the data to the domain mapped out by the DecisionTreeModel:
Show[ListPlot[Normal /@ petalData], regions, {...}]Possible Issues (2)
DecisionTreeModel[]DecisionTreeModel cannot be evaluated without fitting:
DecisionTreeModel[][{Quantity[3, "Minutes"]}]Fit the model to evaluate normally:
model = ModelFit[ResourceData["Sample Data: Old Faithful Eruptions"], DecisionTreeModel[]];
model[{Quantity[3, "Minutes"]}]
DecisionTreeModel can be prone to overfitting on noisy datasets:
data = ResourceData["Sample Data: Old Faithful Eruptions"];
model = ModelFit[data, DecisionTreeModel[]]
Show[
	ListPlot[data, PlotStyle -> StandardGray],
	Plot[model[x], {x, Quantity[1, "Minutes"], Quantity[6, "Minutes"]}]
	]
Hyperparameters give a variety of methods to control how the tree splits the data and reduce overfitting:
spec = {"MaxDepth" -> 2, "MinGain" -> 2, "MinSamples" -> 100, "MinLeafSamples" -> 20};Fit a model for each specification:
models = ModelFit[ data, DecisionTreeModel[#]]& /@ spec;Visualize the fits alongside the original data:
PlotGrid[Partition[MapThread[Show[
	ListPlot[data, PlotStyle  -> { StandardGray, Opacity[0.5]}],
	Plot[#[x], {x, Quantity[1, "Minutes"], Quantity[6, "Minutes"]}],
	PlotLabel -> #2
	]&, {models, spec}], 2], ImageSize -> Medium]
Interactive Examples (1)
Compare the effect of the tree hyperparameters:
Manipulate[Module[{model, data},
	data = BlockRandom[Sin[Range[1000] / 100.] + RandomReal[{-.1, .1}, 1000]];model = N@ModelFit[data,
	DecisionTreeModel[<|"MaxDepth" -> depth, "MinSamples" -> samples, "MinGain" -> gain, "MinLeafSamples" -> leafsamples|>], "Function"];
	ListPlot[{data, model /@ Range[1000.]}, Joined -> {False, True}, InterpolationOrder -> 0, PlotStyle -> {Opacity[.5], Thickness[0.01]}, ImageSize -> Medium]
], {{depth, 3}, 0, 10, 1}, {{samples, 10}, 1, 20, 1}, {{leafsamples, 5}, 1, 20, 1}, {gain, 0, .15}]Text
Wolfram Research (2026), DecisionTreeModel, Wolfram Language function, https://reference.wolfram.com/language/ref/DecisionTreeModel.html.
CMS
Wolfram Language. 2026. "DecisionTreeModel." Wolfram Language & System Documentation Center. Wolfram Research. https://reference.wolfram.com/language/ref/DecisionTreeModel.html.
APA
Wolfram Language. (2026). DecisionTreeModel. Wolfram Language & System Documentation Center. Retrieved from https://reference.wolfram.com/language/ref/DecisionTreeModel.html