


NominalScale
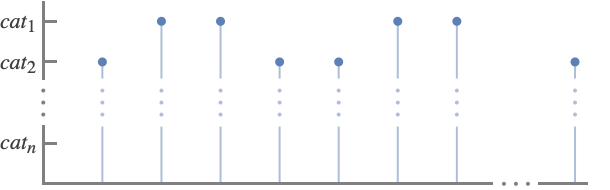
NominalScale[{cat1,cat2,…,catn}]
represents a set of unordered categories cati.
NominalScale[<cat1lab1,…,catnlabn>]
also associates the category cati with the labels labi.
NominalScale[…,<catilabi,…>]
uses labi to represent cati in plots.
automatically determines the categories.
Details and Options
- Nominal scales are used to identify things such as products, names and places. Typical examples include:
-
apple,banana,orange, … fruit categories London,NYC,Miami,Paris,… city categories sad,happy,angry, … emotion categories - Use NominalScale with ScalingFunctions to place categorical values along an axis.
- There is no ordering between the categories; they are either equal or not.
- The categories cati can be any expression.
- NominalScale[…][prop] gives the specified property of an ordinal scale.
- Possible properties include:
-
"CategoryList" list of categories {cat1,…,catn} "LabelAssociation" association of the form <…,catilabi,…> "LabelList" list of labels {lab1,…,labn} "Properties" list of supported properties - NominalScale[…][prop,arg] or NominalScale[…][prop][arg] return the property prop according to the argument arg.
- Possible properties prop and arguments arg include:
-
"Label" cati label labi corresponding to cati "Labels" {…,cati,…} list of labels labi corresponding to cati
Examples
open all close allBasic Examples (4)
Simulate the results of flipping a coin 100 times:
ListPlot[RandomChoice[{"Heads", "Tails"}, 100], ScalingFunctions -> NominalScale[{"Heads", "Tails"}]]Label "Heads" and "Tails" with "H" and "T", respectively:
ListPlot[RandomChoice[{"Heads", "Tails"}, 100], ScalingFunctions -> NominalScale[<|"Heads" -> "H", "Tails" -> "T"|>]]Automatically determine the CPU state categories in a time series:
DateListStepPlot[TemporalData[TimeSeries, {{{"Ready", "Block", "Running", "Running", "Block", "New", "New", "Block",
    "Running", "Suspend", "Termination", "Ready", "Termination", "New", "Suspend", "Ready",
    "Running", "Termination", "New", "Running", "Suspe ... 3.8592938330383577*^9, 3.8593043264340463*^9,
     3.859304976002263*^9, 3.8593105525395226*^9}}}, 1, {"Continuous", 1}, {"Discrete", 1}, 1,
  {ResamplingMethod -> {"Interpolation", InterpolationOrder -> 1}, ValueDimensions -> 1}}, True,
 13.1], ScalingFunctions -> NominalScale[Automatic], Filling -> Bottom]
Show the prices of apples based on the types and sizes:
BubbleChart[IconizedObject[«{{Apple type, size, price}, …}»], ScalingFunctions -> {NominalScale[Automatic], NominalScale[{"125s", "113s", "100s", "88s", "80s", "72s", "64s", "56s"}], None}, AspectRatio -> 1 / 2, FrameLabel -> {{"size", None}, {"type", None}}]Provide labels for coded categories:
BarChart[{2, 3, 2, 1, 5, 3, 3, 1, 1, 3}, ScalingFunctions -> NominalScale[<|1 -> "Full-time", 2 -> "Part-time", 3 -> "Retired", 4 -> "Furloughed", 5 -> "Not Employed"|>], Rule[...]]Scope (23)
Example Scales (11)
Race categories from a survey:
BarChart[{...}, ScalingFunctions -> NominalScale[{"White", "Black", "American Indian", "Asian", "Native Hawaiian", "Other", "Missing"}]]BarChart[{...}, ScalingFunctions -> NominalScale[{"Never married", "Married", "Widowed", "Divorced"}]]BarChart[{...}, ScalingFunctions -> NominalScale[{"Male", "Female", "Other", "Missing"}]]BarChart[{...}, ScalingFunctions -> NominalScale[{"Cirrus", "Cirrostratus", "Cirrocumulus", "Altocumulus", "Altostratus", "Nimbostratus", "Cumulus", "Stratus", "Cumulonimbus", "Stratocumulus"}]]BarChart[{...}, ScalingFunctions -> NominalScale[{"Supercomputer", "Server", "Desktop", "Laptop", "Tablet"}]]BarChart[{...}, ScalingFunctions -> NominalScale[{"Windows", "Linux", "macOS", "Android", "iOS"}]]BarChart[{...}, ScalingFunctions -> NominalScale[{"Africa", "Antarctica", "Asia", "Australia", "Europe", "North America", "South America"}]]BarChart[{...}, ScalingFunctions -> NominalScale[{"Dollars", "Euros", "Yuan", "Yen", "Pesos", "Pounds"}]]BarChart[{...}, ScalingFunctions -> NominalScale[{"Chinese", "English", "French", "German", "Spanish", "Japanese"}]]BarChart[{...}, ScalingFunctions -> NominalScale[{"Sedan", "Coupe", "SUV", "Truck", "Minivan", "Van"}]]BarChart[{...}, ScalingFunctions -> NominalScale[{"Basketball", "Baseball", "Soccer", "Football", "Hockey", "Cricket", "Volleyball"}]]Categories and Labels (7)
Categories can be any type of expression, such as strings:
BarChart[{...}, ScalingFunctions -> NominalScale[{"Apple", "Banana", "Orange", "Pineapple"}]]BarChart[{...}, ScalingFunctions -> NominalScale[{Entity["Country", "France"], Entity["Country", "Germany"], Entity["Country", "Spain"], Entity["Country", "Japan"]}]]BarChart[{...}, ScalingFunctions -> NominalScale[{Red, Orange, Yellow, Green, Blue, Purple}]]BarChart[{...}, ScalingFunctions -> NominalScale[{[image], [image], [image], [image], [image]}]]Numeric categories do not use a numeric scale:
BarChart[{2, 1, 4, 3, 5, 3, 99, 4, 2, 1, 3, 5, 99, 4, 5, 1}, ScalingFunctions -> NominalScale[Automatic]]Assign labels and an order to numeric values:
BarChart[{2, 1, 4, 3, 5, 3, 99, 4, 2, 1, 3, 5, 99, 4, 5, 1}, ScalingFunctions -> NominalScale[<|99 -> "n/a", 1 -> "happy", 2 -> "sad", 3 -> "angry", 4 -> "bored", 5 -> "amused"|>]]Automatically detected categories are shown in the order they appear in the data:
BarChart[{"Rudy", "Katrina", "Bob", "Katrina", "Rudy", "Michelle", "Roger", "Bob"}, ScalingFunctions -> NominalScale[Automatic]]Specify the categories and what order they should appear in:
BarChart[{"Rudy", "Katrina", "Bob", "Katrina", "Rudy", "Michelle", "Roger", "Bob"}, ScalingFunctions -> NominalScale[{"Bob", "Katrina", "Michelle", "Roger", "Rudy"}]]Categories that are omitted from the scale are treated as missing and are not shown:
BarChart[{"Rudy", "Katrina", "Bob", "Katrina", "Rudy", "Michelle", "Roger", "Bob"}, ScalingFunctions -> NominalScale[{"Bob", "Katrina", "Michelle", "Roger"}]]By default, the categories are used as labels:
BarChart[IconizedObject[«cities»], ScalingFunctions -> NominalScale[{"Chicago", "Los Angeles", "Miami", "Dallas", "Denver", "Boston"}]]Specify labels to use in place of the categories:
BarChart[IconizedObject[«cities»], ScalingFunctions -> NominalScale[<|"Chicago" -> "CHI", "Los Angeles" -> "LA", "Miami" -> "MIA", "Dallas" -> "DAL", "Denver" -> "DEN", "Boston" -> "BOS"|>]]Provide labels for individual categories:
BarChart[IconizedObject[«cities»], ScalingFunctions -> NominalScale[Automatic, <|"Los Angeles" -> "LA"|>]]Labels can be any type of expression:
BarChart[IconizedObject[«cities»], ScalingFunctions -> NominalScale[<|"Chicago" -> [image], "Los Angeles" -> x ^ x ^ x, "Miami" -> [image], "Dallas" -> RGBColor[0.5, 0, 0.5], "Denver" -> [image]|>]]Extracting Properties (5)
Obtain a list of properties for a nominal scale:
NominalScale[IconizedObject[«office locations»]]["Properties"]Extract the list of categories:
NominalScale[IconizedObject[«office locations»]]["CategoryList"]Sort the categories alphabetically and create a new scale:
NominalScale[AlphabeticSort[%]]Extract the mapping between categories and labels:
NominalScale[IconizedObject[«office locations»]]["LabelAssociation"]Determine the label for a single category:
NominalScale[IconizedObject[«office locations»]]["Label", "Champaign"]NominalScale[IconizedObject[«office locations»]]["Label"]["Champaign"]Determine the labels for a list of categories:
NominalScale[IconizedObject[«office locations»]]["Labels", {"Champaign", "Boston", "Lima"}]NominalScale[IconizedObject[«office locations»]]["Labels"][{"Champaign", "Boston", "Lima"}]Options (1)
RotateLabel (1)
By default, labels are oriented horizontally:
ListPlot[{{"Alabama ", 1}, {"Alaska ", 74}, {"Arizona ", 41}, {"Arkansas ", 9}, {"California ", 26}, {"Colorado ", 6}, {"Connecticut ", 4}, {"Delaware ", 1}, {"Florida ", 98}, {"Georgia ", 3}}, ScalingFunctions -> {NominalScale[Automatic], None}]Rotate the tick labels for better reading:
ListPlot[{{"Alabama ", 1}, {"Alaska ", 74}, {"Arizona ", 41}, {"Arkansas ", 9}, {"California ", 26}, {"Colorado ", 6}, {"Connecticut ", 4}, {"Delaware ", 1}, {"Florida ", 98}, {"Georgia ", 3}}, ScalingFunctions -> {NominalScale[Automatic, RotateLabel -> 90Degree], None}]Applications (11)
Basic Applications (1)
Use NominalScale in a BubbleChart:
cars = NominalScale[<|1 -> "Ford", 2 -> "Chevrolet", 3 -> "Honda", 4 -> "Toyota", 5 -> "Fiat"|>];state = NominalScale[<|1 -> "Illinois", 2 -> "Indiana", 3 -> "Wisconsin"|>];BubbleChart[Flatten /@ Tally[IconizedObject[«carsales»]], ScalingFunctions -> {state, cars, None},
ColorFunction -> "Rainbow"]Use it in GroupBy:
KeySort /@ GroupBy[IconizedObject[«carsales»], {state["Label", #[[1]]]&, cars["Label", #[[2]]]&}, Length]Dataset[%]Agriculture (1)
Use ParallelAxisPlot to plot multi-categorical orange wholesale data from the USDA:
ParallelAxisPlot[IconizedObject[«orange data»], ScalingFunctions -> NominalScale[Automatic], AxesLabel -> {"Location", "Origin", "Package", "Variety", "Item Size", "Grade"}, ImageSize -> 550, LabelStyle -> 8]Chemistry (3)
Visualize the electrical type of a class of chemical elements:
ListPlot[DeleteMissing[EntityValue[EntityClass["Element", "Metalloid"], {"Name", "ElectricalType"}], 1, 2], ScalingFunctions -> {NominalScale[Automatic, RotateLabel -> 90 °], NominalScale[Automatic]}, Filling -> Bottom]Visualize the natural state of the elements:
GraphicsColumn[Table[ListPlot[Table[{e, ElementData[e, "Phase"]}, {e, ElementData[]}], ScalingFunctions -> {NominalScale[Association[Table[e -> e["Abbreviation"], {e, elems}]]], NominalScale[<|Missing["NotAvailable"] -> "n/a", Entity["MatterPhase", "Gas"] -> "gas", Entity["MatterPhase", "Liquid"] -> "liquid", Entity["MatterPhase", "Solid"] -> "solid"|>]}, AspectRatio -> 1 / 5, Frame -> True], {elems, Partition[ElementData[], UpTo[25]]}], ImageSize -> 500]Plot which blocks the elements are in:
BarChart[Reverse@Table[ElementData[e, "Block"], {e, ElementData[]}], ScalingFunctions -> NominalScale[Automatic], GridLines -> Automatic, ...]Commerce (1)
Use ParallelAxisPlot to plot car specifications with NominalScale:
ParallelAxisPlot[{{"Tesla Model 3", "electricity", "direct drive", 235, "All wheel drive", 4.2}, {"Toyota Camry", "hybrid", "variable-speed", 205, "Front wheel drive", 4.2}, {"Honda Accord", "hybrid", "variable-speed", 225, "Front wheel drive", 4.7}, {"Chevy Bolt", "electricity", "direct drive", 215, "Front wheel drive", 4.6}}, ScalingFunctions -> {NominalScale[Automatic], NominalScale[Automatic], NominalScale[Automatic], None, NominalScale[Automatic], None}, AxesLabel -> {"Car model", "Fuel type", "Transmission", "Tire size", "Drivetrain", "Consumer rating"}, ImageSize -> 420]Weather (1)
Education (1)
Biology (1)
Social Sciences (1)
Plot the political parties of US presidents over time:
DateListStepPlot[TemporalData[EventSeries, {{{"None", "Federalist", "Democratic-Republican", "Democratic", "Whig",
    "Democratic", "Whig", "Democratic", "Republican", "National Union", "Republican", "Democratic",
    "Republican", "Democratic", "Republican", "D ...  1046736000, 1674172800, 1926633600, 2179094400, 2431555200,
     2557785600, 2936476800, 3188937600, 3441398400, 3693859200, 3820089600}}}, 1, {"Discrete", 1},
  {"Discrete", 1}, 1, {ResamplingMethod -> None, ValueDimensions -> 1}}, True, 13.1], ScalingFunctions -> NominalScale[Automatic]]
Markov Chain (1)
Model the process of tossing a coin repeatedly, using a discrete Markov process where the probability of getting heads is 0.6 and getting tails is 0.4:
coin = DiscreteMarkovProcess[1, {{0.6, 0.4}, {0.6, 0.4}}];tosses = RandomFunction[coin, {0, 49}]ListPlot[tosses, ScalingFunctions -> {None, NominalScale[<|1 -> "Head", 2 -> "Tail"|>]}, Filling -> Axis]Text
Wolfram Research (2022), NominalScale, Wolfram Language function, https://reference.wolfram.com/language/ref/NominalScale.html.
CMS
Wolfram Language. 2022. "NominalScale." Wolfram Language & System Documentation Center. Wolfram Research. https://reference.wolfram.com/language/ref/NominalScale.html.
APA
Wolfram Language. (2022). NominalScale. Wolfram Language & System Documentation Center. Retrieved from https://reference.wolfram.com/language/ref/NominalScale.html