

OrdinalScale
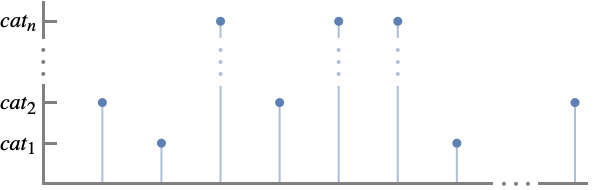
OrdinalScale[{cat1,cat2,…,catn}]
represents a set of ordered categories cati with order cat1<cat2<…<catn.
OrdinalScale[{cat1,…,catn},{val1,…,valn}]
associates the category cati with the numeric value vali.
OrdinalScale[<cat1val1,…,catnvaln>]
also associates the category cati with the numeric value vali.
OrdinalScale[{cat1,…,catn},vals,{lab1,…,labn}]
displays the category cati as the corresponding labi when used as a label in plots etc.
OrdinalScale[…,<catilabi,…>]
uses labi to represent cati in plots.
Details and Options
- Ordinal scales are used to rank ordered things such as movie ratings, product quality and pain level. Typical examples include:
-
tiny<small<medium<large size categories ★<★★<★★★<★★★★<★★★★★ rating categories F<D<C<B<A grade categories - Use OrdinalScale with ScalingFunctions to place categorical values along an axis.
- The categories cati can be any expression.
- By default, the category cati is given the value i for vali.
- The numerical values vali can be any real number.
- cati is considered to be less than catj if vali<valj.
- If two categories cati and catj have the same associated numeric value val, they are considered to be in the same categorical class and one will be selected as the typical element.
- When specifying labels, the value specification vals may be Automatic.
- OrdinalScale[…][prop] gives the specified property of an ordinal scale.
- Possible properties include:
-
"CategoryAssociation" association of the form <…,valicati,…> "CategoryList" list of categories {cat1,…,catn} "LabelAssociation" association of the form <…,catilabi,…> "LabelList" list of labels {lab1,…,labn} "ValueAssociation" association of the form <…,cativali,…> "ValueList" list of values {val1,…,valn} "Properties" list of supported properties - OrdinalScale[…][prop,arg] or OrdinalScale[…][prop][arg] return the property prop according to the argument arg.
- Possible properties prop and arguments arg include:
-
"Category" vali categories cati corresponding to vali "Categories" {…,vali,…} list of categories cati corresponding to vali "Label" cati labels labi corresponding to cati "Labels" {…,cati,…} list of labels labi corresponding to cati "Value" cati values vali corresponding to cati "Values" {…,cati,…} list of values vali corresponding to cati
Examples
open all close allBasic Examples (5)
Visualize a consumer satisfaction survey data:
ListPlot[IconizedObject[«consumer satisfaction survey»], ScalingFunctions -> OrdinalScale[{"Totally Dissatisfied", "Dissatisfied", "Neutral", "Satisfied", "Totally Satisfied"}]]Provide values for satisfaction levels:
ListPlot[IconizedObject[«consumer satisfaction survey»], ScalingFunctions -> OrdinalScale[{"Totally Dissatisfied", "Dissatisfied", "Neutral", "Satisfied", "Totally Satisfied"}, {-1, 0, 1, 3, 6}]]Specify a label for a category:
BarChart[{"A", "C", "B", "F", "C", "B"}, ChartLabels -> {"Alice", "Bill", "Chris", "Derek", "Eric", "Fiona"},
	ScalingFunctions -> OrdinalScale[<|"A" -> 5, "B" -> 4, "C" -> 3, "D" -> 2, "F" -> 1|>,
	<|"F" -> "Failed"|>]]
Provide the scale order of ordinal data:
BubbleChart[IconizedObject[«egg size comparison»], ScalingFunctions -> {NominalScale[Automatic], OrdinalScale[{"Peewee", "Small", "Medium", "Large", "Extra Large", "Jumbo", "King"}], None}]Use categorical labels to represent a list of numerical ratings:
ListPlot[{5, 4, 4, 1, 5, 1, 3, 4, 5, 2}, ScalingFunctions -> {None, OrdinalScale[{1, 2, 3, 4, 5}, Automatic, <|1 -> "★", 2 -> "★★", 3 -> "★★★", 4 -> "★★★★", 5 -> "★★★★★"|>]},
	Filling -> Bottom]
Plot a time series of physical exertion with the Borg CR10 scale:
DateListStepPlot[TemporalData[TimeSeries, {{{"Extremely hard", "Extremely hard", "Extremely hard", "Very hard",
    "Hard", "Hard", "Hard", "Somewhat hard", "Somewhat hard", "Moderate", "Moderate", "Moderate",
    "Light", "Light", "Very light", "Very light", "Ex ...  {TemporalData`DateSpecification[{2020, 1, 1, 1, 0, 0.}, {2020, 5, 27, 1, 0, 0.}, {1, "Week"}]},
  1, {"Continuous", 1}, {"Discrete", 1}, 1,
  {ResamplingMethod -> {"Interpolation", InterpolationOrder -> 1}, ValueDimensions -> 1}}, True,
 13.1], ScalingFunctions -> OrdinalScale[IconizedObject[«Borg CR10»]], GridLines -> All, Frame -> True]
Scope (31)
Example Scales (10)
Seven-point Likert rating scale:
BarChart[{...}, ScalingFunctions -> OrdinalScale[{"Strongly Disagree", "Disagree", "Somewhat Disagree", "Neither Agree nor Disagree", "Somewhat Agree", "Agree", "Strongly Agree"}]]Borg-RPE scale for assessing physical exertion:
BarChart[{...}, ScalingFunctions -> OrdinalScale[<|"No exertion at all" -> 6, "Extremely light" -> 7, "Very light" -> 9, "Light" -> 11, "Somewhat hard" -> 13, "Hard" -> 15, "Very hard" -> 17, "Extremely hard" -> 19, "Maximal exertion" -> 20|>]]BarChart[{...}, ScalingFunctions -> OrdinalScale[<|"No exertion at all" -> 0, "Extremely light" -> 0.5, "Very light" -> 1, "Light" -> 2, "Somewhat hard" -> 3, "Hard" -> 5, "Very hard" -> 7, "Extremely hard" -> 10|>]]BarChart[{...}, ScalingFunctions -> OrdinalScale[<|"C" -> -4, "Ca" -> -3, "Caa3" -> -2, "Caa2" -> -1, "Caa1" -> 0, "B3" -> 1, "B2" -> 2, "B1" -> 3, "Ba3" -> 4, "Ba2" -> 5, "Ba1" -> 6, "Baa3" -> 7, "Baa2" -> 8, "Baa1" -> 9, "A3" -> 10, "A2" -> 11, "A1" -> 12, "Aa3" -> 13, "Aa2" -> 14, "Aa1" -> 15, "Aaa" -> 16|>]]BarChart[{...}, ScalingFunctions -> OrdinalScale[{"Tiny", "Small", "Medium", "Large", "Extra Large"}]]BarChart[{"White", "Yellow", "Orange", "Green", "Blue", "Brown", "Black", "Red"}, ScalingFunctions -> OrdinalScale[{"White", "Yellow", "Orange", "Green", "Blue", "Brown", "Black", "Red"}, Automatic, <|"White" -> "Beginner", "Yellow" -> "9th Kyu", "Orange" -> "8th & 7th Kyu", "Green" -> "6th & 5th Kyu", "Blue" -> "4th & 3rd Kyu", "Brown" -> "2nd & 1st Kyu", "Black" -> "Dan", "Red" -> "Grandmaster"|>],
ChartStyle -> {White, Yellow, Orange, Green, Blue, Brown, Black, Red}]BarChart[{...}, ScalingFunctions -> OrdinalScale[<|"Small feeder" -> 1000, "Feeder" -> 2000, "Feedermax" -> 3000, "Panamax" -> 5100, "Post-panamax" -> 10000, "New Panamax" -> 14500|>]]BarChart[{...}, ScalingFunctions -> OrdinalScale[{"Pain free", "Very Mild", "Discomforting", "Tolerable", "Distressing", "Very Distressing", "Intense", "Very Intense", "Utterly Horrible", "Excruciating Unbearable", "Unimaginable Unspeakable"}, Range[11] - 1]]BarChart[{...}, ScalingFunctions -> OrdinalScale[{"Canner", "Cutter", "Utility", "Commercial", "Standard", "Select", "Choice", "Prime"}]
]BarChart[{...}, ScalingFunctions -> OrdinalScale[{"US No.3", "US No.2 Russet", "US No.2", "US No.2 Bright", "US No.1 Russet", "US No.1 Bronze", "US No.1 Golden", "US No.1", "US No.1 Bright", "US Fancy"}]
]BarChart[{...}, ScalingFunctions -> OrdinalScale[<|"Peewee" -> 15, "Small" -> 18, "Medium" -> 21, "Large" -> 24, "Extra Large" -> 27, "Jumbo" -> 30|>]
]Categories, Values and Labels (7)
Categories can be any type of expression, such as strings:
BarChart[{"Yellow Pine", "Hard Maple", "Black Walnut", "Hard Maple", "Hard Maple", "Red Oak", "Yellow Pine", "Red Oak", "Hard Maple", "Red Oak"}, ScalingFunctions -> OrdinalScale[<|"Douglas Fir" -> 660, "Yellow Pine" -> 870, "Black Walnut" -> 1010, "Red Oak" -> 1290, "Hard Maple" -> 1450, "Hickory" -> 1820|>]]BarChart[{Entity["Aircraft", "Boeing767"], Entity["Aircraft", "JumboJet"], Entity["Aircraft", "Boeing767"], Entity["Aircraft", "Boeing787"], Entity["Aircraft", "Boeing767"], Entity["Aircraft", "Boeing737"], Entity["Aircraft", "Boeing787"]}, ScalingFunctions -> OrdinalScale[{Entity["Aircraft", "Boeing737"], Entity["Aircraft", "Boeing767"], Entity["Aircraft", "Boeing787"], Entity["Aircraft", "Boeing777"], Entity["Aircraft", "JumboJet"]}]]BarChart[{RGBColor[0, 1, 0], RGBColor[1, 0.5, 0], RGBColor[1, 1, 0], RGBColor[0.5, 0, 0.5], RGBColor[0, 0, 1], RGBColor[0, 0, 1], RGBColor[0.5, 0, 0.5], RGBColor[0, 1, 0], RGBColor[0, 0, 1], RGBColor[1, 0, 0], RGBColor[1, 1, 0], RGBColor[1, 0, 0], RGBColor[1, 0.5, 0], RGBColor[0, 0, 1], RGBColor[0.5, 0, 0.5]}, ScalingFunctions -> OrdinalScale[{Red, Orange, Yellow, Green, Blue, Purple}]]BarChart[{[image], [image], [image], [image]}, ScalingFunctions -> OrdinalScale[{[image], [image], [image], [image]}]]Numeric categories do not use a numeric scale:
BarChart[{1, 2, 4, 8, 12, 24}, ScalingFunctions -> OrdinalScale[{1, 2, 4, 8, 12, 24}]]By default, OrdinalScale values are automatically assigned:
ListPlot[{"C4", "D4", "E4", "F4", "G4", "A4", "B4"}, ScalingFunctions -> OrdinalScale[{"C4", "D4", "E4", "F4", "G4", "A4", "B4"}],
	Filling -> Bottom]
Provide the values for the 5th octave of music notes:
ListPlot[{"C4", "D4", "E4", "F4", "G4", "A4", "B4"}, ScalingFunctions -> OrdinalScale[{"C4", "D4", "E4", "F4", "G4", "A4", "B4"}, {262, 293, 330, 349, 392, 440, 494}],
Filling -> Bottom]ListPlot[{"C4", "D4", "E4", "F4", "G4", "A4", "B4"}, ScalingFunctions -> OrdinalScale[{"C4", "D4", "E4", "F4", "G4", "A4", "B4"}, {262, 293, 330, 349, 392, 440, 494}, {"SubscriptBox[C, 4]", "SubscriptBox[D, 4]", "SubscriptBox[E, 4]", "SubscriptBox[F, 4]", "SubscriptBox[G, 4]", "SubscriptBox[A, 4](440Hz)", "SubscriptBox[B, 4]"}],
Filling -> Bottom]Categories that are omitted from the scale are treated as missing and are not shown:
BarChart[{"Large", "Tiny", "XLarge", "XLarge", "Tiny", "Medium", "Medium", "XLarge"}, ScalingFunctions -> OrdinalScale[{"Small", "Medium", "Large", "XLarge"}]]By default, the categories are used as labels:
BarChart[{"XLarge", "Small", "XLarge", "Small", "Large", "Medium", "Medium", "Large", "Large", "Large"}, ScalingFunctions -> OrdinalScale[{"Small", "Medium", "Large", "XLarge"}]]Specify labels to use in place of the categories:
BarChart[{"XLarge", "Small", "XLarge", "Small", "Large", "Medium", "Medium", "Large", "Large", "Large"}, ScalingFunctions -> OrdinalScale[{"Small", "Medium", "Large", "XLarge"}, Automatic, <|"Small" -> "S", "Medium" -> "M", "Large" -> "L", "XLarge" -> "XL"|>]]Provide labels for individual categories:
BarChart[{"XLarge", "Small", "XLarge", "Small", "Large", "Medium", "Medium", "Large", "Large", "Large"}, ScalingFunctions -> OrdinalScale[{"Small", "Medium", "Large", "XLarge"}, Automatic, <|"XLarge" -> "XL"|>]]Labels can be any type of expression:
BarChart[{2, 4, 3, 5, 1, 4, 2, 2, 2, 3}, ScalingFunctions -> OrdinalScale[Range[5], <|1 -> Abs[x], 2 -> [image], 3 -> [image], 4 -> RGBColor[0.5, 0, 0.5], 5 -> [image]|>]]Extracting Properties (14)
Obtain a list of properties for a nominal scale:
OrdinalScale[IconizedObject[«likert scale»]]["Properties"]Extract the list of categories:
OrdinalScale[IconizedObject[«likert scale»]]["CategoryList"]OrdinalScale[IconizedObject[«likert scale»]]["ValueList"]Extract the mapping between categories and values:
OrdinalScale[IconizedObject[«likert scale»]]["ValueAssociation"]Extract the mapping between values and categories:
OrdinalScale[IconizedObject[«likert scale»]]["CategoryAssociation"]OrdinalScale[IconizedObject[«likert scale»]]["LabelList"]Extract the mapping between categories and labels:
OrdinalScale[IconizedObject[«likert scale»]]["LabelAssociation"]Determine the value for a single category:
OrdinalScale[IconizedObject[«likert scale»]]["Value", "Satisfied"]OrdinalScale[IconizedObject[«likert scale»]]["Value"]["Satisfied"]Determine the category for a value:
OrdinalScale[IconizedObject[«likert scale»]]["Category", 5]OrdinalScale[IconizedObject[«likert scale»]]["Category"][5]Determine the values for a list of categories:
OrdinalScale[IconizedObject[«likert scale»]]["Values", {"Unsatisfied", "Very Unsatisfied", "Very Satisfied", "Satisfied", "Very Satisfied", "Very Unsatisfied", "Very Unsatisfied", "Very Satisfied"}]Determine the labels for a list of categories:
OrdinalScale[IconizedObject[«likert scale»]]["Labels", {"Unsatisfied", "Very Unsatisfied", "Very Satisfied", "Satisfied", "Very Satisfied", "Very Unsatisfied", "Very Unsatisfied", "Very Satisfied"}]Use in a visualization function:
BarChart[{"Unsatisfied", "Very Unsatisfied", "Very Satisfied", "Satisfied", "Very Satisfied", "Very Unsatisfied", "Very Unsatisfied", "Very Satisfied"}, ScalingFunctions -> OrdinalScale[IconizedObject[«likert scale»]]]By default, values are automatically assigned:
OrdinalScale[{"Very Unsatisfied", "Unsatisfied", "Neural", "Satisfied", "Very Satisfied"}]["ValueAssociation"]OrdinalScale[{"Very Unsatisfied", "Unsatisfied", "Neural", "Satisfied", "Very Satisfied"}, {-4, -2, 0, 2, 6}]["ValueAssociation"]OrdinalScale[{"Very Unsatisfied", "Unsatisfied", "Neural", "Satisfied", "Very Satisfied"}, {-4, -2, 0, 2, 6}, {{"angry", "annoyed", "neutral", "smily", "happy"}}]["LabelAssociation"]Orders are specified automatically:
OrdinalScale[{"A", "B", "C"}]["ValueAssociation"]OrdinalScale[{"A", "B", "C"}, {2, 3, 1}]["ValueAssociation"]Use Association to specify categories and values:
OrdinalScale[<|"A" -> 2, "B" -> 3, "C" -> 1|>]["ValueAssociation"]Categories that share the same value are combined:
ListPlot[{"D", "B", "C", "A", "D", "C", "B", "D", "C", "D"}, ScalingFunctions -> {None, OrdinalScale[<|"A" -> 1, "B" -> 2, "C" -> 3, "D" -> 2|>]}]Applications (8)
Agriculture (2)
Plot a time series of egg size change of a growing hen:
DateListStepPlot[TemporalData[TimeSeries, {{{"Peewee", "Small", "Medium", "Large", "Extra Large", "Jumbo"}},
  {{{3.8214920541544046*^9, 3.8217111542537756*^9, 3.8227325729100084*^9, 3.8234681794958987*^9,
     3.8273510174461837*^9, 3.828068401574386*^9}}}, 1, {"Continuous", 1}, {"Discrete", 1}, 1,
  {ResamplingMethod -> {"Interpolation", InterpolationOrder -> 1}, ValueDimensions -> 1}}, False,
 13.1], ScalingFunctions -> {None, OrdinalScale[<|"Peewee" -> 15, "Small" -> 18, "Medium" -> 21, "Large" -> 24, "Extra Large" -> 27, "Jumbo" -> 30|>]}]
Show the prices of apples based on the types and sizes:
BubbleChart[IconizedObject[«{{Apple type, size, price}, …}»], ScalingFunctions -> {NominalScale[Automatic], OrdinalScale[{"125s", "113s", "100s", "88s", "80s", "72s", "64s", "56s"}], None}, AspectRatio -> 1 / 2, FrameLabel -> {{"size", None}, {"type", None}}]Finance (2)
Plot US states' bond ratings in 2021 with a predefined Moody rating scale:
ListPlot[IconizedObject[«Moody state ratings 2021»], ScalingFunctions -> {NominalScale[Automatic, RotateLabel -> True], OrdinalScale[IconizedObject[«Moody Bond Ratings»]]}, ImageSize -> 400, LabelStyle -> 8, GridLines -> All, ColorFunction -> ColorData[{"Rainbow", "Reverse"}]]Plot in S&P and Fitch rating scales:
ListPlot[IconizedObject[«S&P state ratings 2021»], ScalingFunctions -> {NominalScale[Automatic, RotateLabel -> True], OrdinalScale[IconizedObject[«S&PBondRatings»]]}, ImageSize -> 400, LabelStyle -> 8, GridLines -> All, ColorFunction -> ColorData[{"Rainbow", "Reverse"}]]ListPlot[IconizedObject[«Fitch state ratings 2021»], ScalingFunctions -> {NominalScale[Automatic, RotateLabel -> True], OrdinalScale[IconizedObject[«FitchBondRatings»]]}, ImageSize -> 400, LabelStyle -> 8, GridLines -> All, ColorFunction -> ColorData[{"Rainbow", "Reverse"}]]Historical S&P bond ranking of Illinois:
illinois = TimeSeries[Reverse@{"BBB", "BBB-", "BBB-", "BBB-", "BBB-", "BBB", "A-", "A-", "A-", "A", "A+", "A+", "A+", "AA", "AA", "AA", "AA", "AA", "AA", "AA", "AA"}, {{2001, 1, 1}, {2021, 1, 1}, "Year"}]DateListPlot[illinois, ScalingFunctions -> OrdinalScale["S&P"], DateTicksFormat -> {"Year"}]Markov Chain (1)
Visualize simulations of the gambler's ruin process in ListLinePlot with OrdinalScale:
GamblersRuin[p_, n_] := SparseArray[{{1, 1} -> 1, {n + 1, n + 1} -> 1, {i_, j_} /; 1 < i < n + 1 && j == i + 1 -> p, {i_, j_} /; 1 < i < n + 1 && j == i - 1 -> 1 - p}, {n + 1, n + 1}]With a winning probability of 0.5, the player's initial wealth is 7 and the total wealth is 10 between the player and the host. The states here are the integers 1 through 11, representing the gambler's wealth plus one:
gamblerwealth = DiscreteMarkovProcess[8, GamblersRuin[0.5, 10]];Simulate 15 times to observe that given a fair game, the winning possibility—that is the possibility of taking the whole wealth—depends on the player's initial wealth and the total wealth:
path = Table[RandomFunction[gamblerwealth, {0, 50}]["Values"], {15}];ListLinePlot[path, ScalingFunctions -> {None, OrdinalScale[Range[11], <|1 -> "Ruin", 11 -> "Win"|>]}, PlotLabels -> Range[15], ImageSize -> 450]Education (1)
Medical (1)
Show pain scale for various injuries:
ListPlot[{{"Sprain", "Discomforting"}, {"Laceration", "Distressing"}, {"Cut", "Very Distressing"}, {"Fracture", "Intense"}, {"Bruise", "Very Intense"}, {"Digit amputation", "Excruciating Unbearable"}}, ScalingFunctions -> {NominalScale[Automatic, RotateLabel -> True], OrdinalScale[{"Pain free", "Very Mild", "Discomforting", "Tolerable", "Distressing", "Very Distressing", "Intense", "Very Intense", "Utterly Horrible", "Excruciating Unbearable", "Unimaginable Unspeakable"}, Range[11] - 1]},
	Filling -> Bottom]
Classification (1)
Use OrdinalScale value associations for classification:
woodhardnessscale = OrdinalScale[<|"Douglas Fir" -> 660, "Yellow Pine" -> 870, "Black Walnut" -> 1010, "Red Oak" -> 1290, "Hard Maple" -> 1450, "Hickory" -> 1820|>];woodhardness = Nearest[woodhardnessscale["ValueList"]]similarwood[hardness_] := woodhardnessscale["CategoryAssociation"][First@woodhardness[hardness]]Given a hardness value, find a similar hardwood:
similarwood[785]similarwood[1787]Text
Wolfram Research (2022), OrdinalScale, Wolfram Language function, https://reference.wolfram.com/language/ref/OrdinalScale.html.
CMS
Wolfram Language. 2022. "OrdinalScale." Wolfram Language & System Documentation Center. Wolfram Research. https://reference.wolfram.com/language/ref/OrdinalScale.html.
APA
Wolfram Language. (2022). OrdinalScale. Wolfram Language & System Documentation Center. Retrieved from https://reference.wolfram.com/language/ref/OrdinalScale.html