

PlotLegends
is an option for plot functions that specifies what legends to use.
Details
- Typical settings for PlotLegends include:
-
None add no legend Automatic use automatic legending "Expressions" use formulas as legend labels {lbl1,lbl2,…} use lbli for the i ") input
inputexpr use expr as legend Placed[leg,pos] specify placement of legend - The following legend constructors can be used to form commonly occurring legends: SwatchLegend, LineLegend, PointLegend and BarLegend.
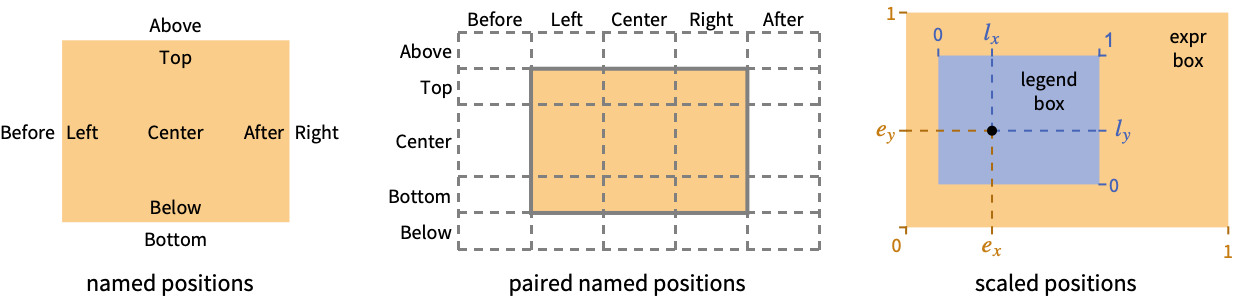
- PlotLegendsPlaced[leg,pos] places the legend leg at the position specified by pos.
- Possible forms for pos are:
-
Above,Below,Before,After positions outside the bounding box for expr {h,v} horizontal h and vertical positions v {{ex,ey},{lx,ly}} scaled position {lx,ly} in the legend at scaled position {ex,ey} in expr - Possible horizontal positions include Before, Left, Center, Right and After.
- Possible vertical positions include Below, Bottom, Center, Top and Above.
Examples
open all close allBasic Examples (5)
Use editable placeholders as the legend for a plot:
Plot[{Sin[x], Cos[x]}, {x, 0, 2π}, PlotLegends -> Automatic]Use the expressions being plotted as the legend:
LogPlot[{Sin[x ^ 2 + 1], Cos[x ^ 2 + 1]}, {x, 0, π}, PlotLegends -> "Expressions"]Specify the text for a legend:
ListPlot[Table[f, {f, {Sin[x], Cos[x]}}, {x, 0, 2π, 0.1}], PlotLegends -> {"sin(x)", "cos(x)"}]Place the legend below the plot:
DensityPlot[Sin[x + y]Cos[x - y], {x, 0, 10}, {y, 0, 10}, PlotLegends -> Placed[Automatic, Below]]Plot[{BesselJ[2, x], BesselJ[3, x]}, {x, 0, 20}, PlotLegends -> Placed["Expressions", {Right, Top}]]Scope (5)
Legend Content (2)
Use LineLegend to construct a legend:
Plot[{Sin[x], Cos[x]}, {x, 0, 2π}, PlotLegends -> LineLegend["Expressions", LegendLabel -> "label", LegendFunction -> (Framed[#, RoundingRadius -> 5]&), LegendMargins -> 5]]Use SwatchLegend to construct a legend:
Plot[{Sin[x], Cos[x]}, {x, 0, 2π}, PlotLegends -> SwatchLegend["Expressions", LegendLabel -> "label", LegendFunction -> (Framed[#, Background -> StandardGray]&)]]BarLegend is used in ContourPlot and DensityPlot:
ContourPlot[Sin[x y], {x, 0, 1}, {y, 0, 1}, PlotLegends -> Automatic]DensityPlot[Sin[x y], {x, 0, 1}, {y, 0, 1}, PlotLegends -> Automatic]Use SwatchLegend to construct a legend:
legend = SwatchLegend[{Red, Blue}, {"f1", "f2"}, LegendMarkers -> Graphics[{EdgeForm[Black], Opacity[0.5], Rectangle[]}], LegendLabel -> "label", LegendFunction -> (Framed[#, RoundingRadius -> 5]&), LegendMargins -> 5]Plot[{Sin[x], Cos[x]}, {x, 0, 2π}, PlotStyle -> StandardGray, Filling -> {1 -> {Axis, Directive[Opacity[0.5], Red]}, 2 -> {Axis, Directive[Opacity[0.5], Blue]}}, PlotLegends -> legend]A legend can be any expression:
legend = Grid[{{Graphics[{Red, Disk[{0, 0}, 0.1]}, ImageSize -> 5], "slope = 0"}}]Plot[-(x - 5) ^ 2 + 10, {x, 0, 10}, AxesOrigin -> {0, -16}, Epilog -> {Red, AbsolutePointSize[5], Point[{5, 10}]}, PlotLegends -> Placed[legend, {{1.05, 0.5}, {0, 0.5}}]]Legend Placement (3)
Use Placed to change legend placement:
Table[Plot[{Sin[x], Cos[x]}, {x, 0, 2π}, Frame -> True, Axes -> False, PlotLegends -> Placed["Expressions", pos], PlotLabel -> pos], {pos, {Before, After, Below, Above}}]Table[Plot[{Sin[x], Cos[x]}, {x, 0, 2π}, Frame -> True, Axes -> False, PlotLegends -> Placed["Expressions", pos], PlotLabel -> pos], {pos, {Left, Right, Bottom, Top}}]Use named horizontal and vertical positions to place a legend:
Table[Plot[{Sin[x], Cos[x]}, {x, 0, 2π}, Frame -> True, Axes -> False, PlotLegends -> Placed["Expressions", {pos, Center}], PlotLabel -> {pos, Center}], {pos, {Before, Left, Right, After}}]Table[Plot[{Sin[x], Cos[x]}, {x, 0, 2π}, Frame -> True, Axes -> False, PlotLegends -> Placed["Expressions", {Center, pos}], PlotLabel -> {Center, pos}], {pos, {Below, Bottom, Top, Above}}]Use scaled coordinates associated with plot range to place a legend:
Plot[{Sin[x], Cos[x]}, {x, 0, 2π}, Frame -> True, Axes -> False, PlotRangeClipping -> False, PlotLegends -> Placed["Expressions", {Scaled[{0, 0.5}], {0, 0.5}}]]For fine-control legend placement, specify the position where a legend should be placed:
Table[Plot[{Sin[x], Cos[x]}, {x, 0, 2π}, Frame -> True, Axes -> False, PlotLegends -> Placed[Automatic, {{1, 0.5}, epos}], PlotLabel -> epos], {epos, {{0, 0}, {0, 1}}}]Text
Wolfram Research (2012), PlotLegends, Wolfram Language function, https://reference.wolfram.com/language/ref/PlotLegends.html.
CMS
Wolfram Language. 2012. "PlotLegends." Wolfram Language & System Documentation Center. Wolfram Research. https://reference.wolfram.com/language/ref/PlotLegends.html.
APA
Wolfram Language. (2012). PlotLegends. Wolfram Language & System Documentation Center. Retrieved from https://reference.wolfram.com/language/ref/PlotLegends.html