

VariogramFunction
is an option to SpatialEstimate that specifies the local variation model to use.
Details
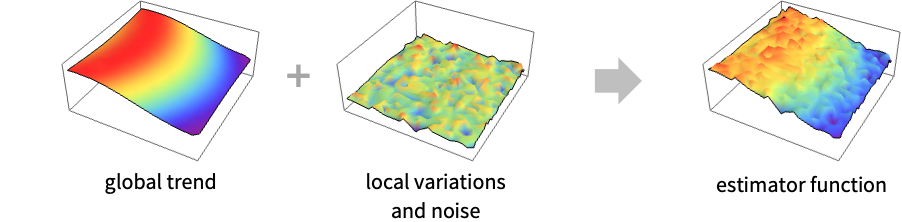
- VariogramFunction together with SpatialNoiseLevel is used to make local predictions of spatial values. Combining local predictions with a global trend gives the full spatial prediction function.
- The local variation is described using a variogram
 , where
  is a spatial field of values. When the spatial field is weakly stationary and isotropic,
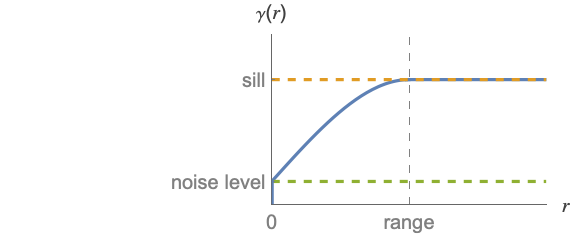
 ![gamma(p_1,p_2)=gamma(TemplateBox[{{{p, _, 1}, -, {p, _, 2}}}, Norm])](Files/VariogramFunction.en/4.png "gamma(p_1,p_2)=gamma(TemplateBox[{{{p, _, 1}, -, {p, _, 2}}}, Norm])") . A typical isotropic variogram can be described in terms of its sill, range and noise variance.
. A typical isotropic variogram can be described in terms of its sill, range and noise variance. - For full details, see the EstimatedVariogramModel page.
- The following settings can be used:
-
Automatic automatically compute a variogram "model" fit "model" variogram {"model",pars} use "model" with given parameters pars VariogramModel[…] use fully specified variogram model - The possible "model" values are given in VariogramModel.
Examples
open all close allBasic Examples (1)
Use SpatialEstimate with specified variogram function:
data = SpatialPointData[«2»];The data consists of rainfall observations in Switzerland:
Show[Region[data["ObservationRegion"]], PointValuePlot[data, ColorFunction -> "Rainbow"]]Create spatial predictor function with exponential variogram model:
locs = data["Points"];
vals = data["Annotations"]["Rainfall"];spf = SpatialEstimate[locs -> vals, VariogramFunction -> "Exponential"]Visualize the estimator values over the observation region:
sim = RandomPoint[data["ObservationRegion"], 2000];PointValuePlot[sim -> spf[sim], ColorFunction -> "Rainbow", AspectRatio -> .7]Scope (1)
Use SpatialEstimate with fitted variogram function:
data = SpatialPointData[«2»];The data consists of rainfall observations in Switzerland:
Show[Region[data["ObservationRegion"]], PointValuePlot[data, ColorFunction -> "Rainbow"]]Fit a cubic variogram model and use it for spatial prediction:
locs = data["Points"];
vals = data["Annotations"]["Rainfall"];cvf = EstimatedVariogramModel[locs -> vals, "Cubic"]cvf["Visualization"]Compute the prediction functions with the fitted cubic variogram model:
spf = SpatialEstimate[locs -> vals, VariogramFunction -> cvf]spf["Visualization", "Data" -> True, Method -> "3D"]Applications (1)
Specifying VariogramFunction in SpatialEstimate allows you to obtain a gallery of models:
data = ResourceData["Sample Data: Swiss Rainfall"]Show[Region[data["ObservationRegion"]], PointValuePlot[data, ColorFunction -> "Rainbow"]]Compute estimates using specific models:
models = {"Cubic", "Spherical", "Exponential", "Gaussian"};estimates = SpatialEstimate[data, VariogramFunction -> #]& /@ models;Create a set of random points and compute the estimated values at these locations:
pts = RandomPoint[data["ObservationRegion"], 2000];
vals = Comap[estimates, pts];
Visualize rainfall values over the whole region:
Grid@ArrayReshape[#, {2, 2}]&@MapThread[Show[Region[data["ObservationRegion"]], PointValuePlot[pts -> #1, PlotStyle -> PointSize[0.015], ColorFunction -> "Rainbow"], PlotLabel -> #2]&, {vals, models}]Text
Wolfram Research (2021), VariogramFunction, Wolfram Language function, https://reference.wolfram.com/language/ref/VariogramFunction.html.
CMS
Wolfram Language. 2021. "VariogramFunction." Wolfram Language & System Documentation Center. Wolfram Research. https://reference.wolfram.com/language/ref/VariogramFunction.html.
APA
Wolfram Language. (2021). VariogramFunction. Wolfram Language & System Documentation Center. Retrieved from https://reference.wolfram.com/language/ref/VariogramFunction.html