"DBSCAN" (Machine Learning Method)
- Method for FindClusters, ClusterClassify and ClusteringComponents.
- Partitions data into clusters of similar elements using density-based spatial clustering of applications with noise (DBSCAN).
Details & Suboptions
- "DBSCAN" (density-based spatial clustering of applications with noise) is a density-based clustering method where the density is estimated using a neighbor-based approach. "DBSCAN" works for arbitrary cluster shapes and sizes but requires clusters to have similar densities.
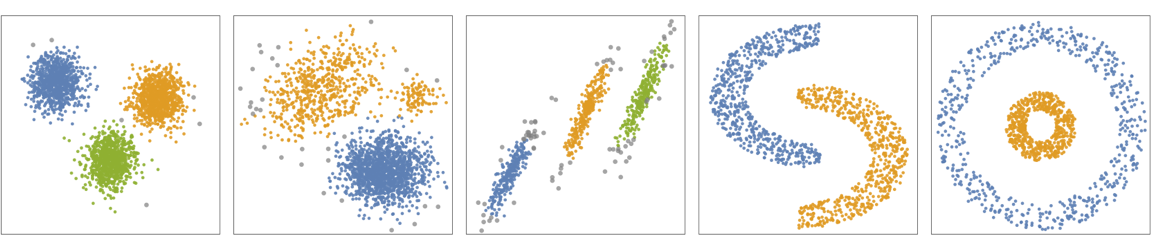
- The following plots show the results of the "DBSCAN" method applied to toy datasets (black points indicate outliers):
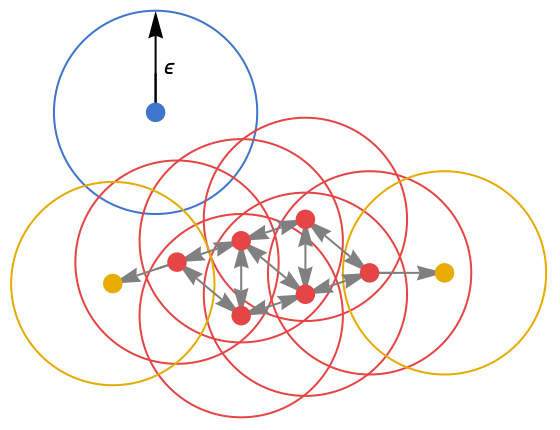
- "DBSCAN" defines "core points" as data points that have more than k neighbors within a ball of ϵ radius (i.e. data points in high-density regions). Then, core points that are at a distance of less than ϵ from each other define a cluster. Furthermore, any point that is at a distance of less than ϵ of a core point belongs to the cluster of the core point. Any point that is not near a core point is considered noise.
- This results in each cluster containing one or more core points at its core and some non-core points at its "edge". Overall, "DBSCAN" defines clusters as connected high-density regions. In the following figure, core points are red, edge points are yellow and noise points are blue:
- In ClusteringComponents and ClusterClassify, noise points are labeled Missing["Anomalous"].
- In FindClusters, noise points are returned as a cluster.
- The option DistanceFunction can be used to define which distance to use.
- The following suboptions can be given:
-
"NeighborhoodRadius" Automatic radius ϵ "NeighborsNumber" Automatic number of neighbors k "DropAnomalousValues" False whether to drop outliers
Examples
open all close allBasic Examples (3)
Find clusters of nearby values using the "DBSCAN" method:
FindClusters[{1, 2, 10, 12, 3, 1, 13, 25}, Method -> "DBSCAN"]Train the ClassifierFunction on a list of colors using the "DBSCAN" method:
colors = RandomColor[70];
c = ClusterClassify[colors, Method -> "DBSCAN"]
Gather the elements by their class number:
GatherBy[colors, c]SeedRandom[123]
data = Join[RandomReal[1, {100, 2}], RandomReal[{-3, -.1}, {100, 2}]];
ListPlot[data]Plot clusters in data found using the "DBSCAN" method:
ListPlot[FindClusters[data, Method -> "DBSCAN"]]Scope (2)
Obtain a random list of times:
data = TimeObject /@ RandomReal[AbsoluteTime[]//Round, 20]Train the ClassifierFunction using the "DBSCAN" method:
c = ClusterClassify[data, Method -> "DBSCAN"]Obtain the cluster assignment and cluster the data:
assignment = c[data]
GatherBy[data, c]
Train the ClassifierFunction using the "DBSCAN" method:
data = {1000, 1, 2, 3, 1.1, 2, 9, 8, 7, 6, 4, 1, .5, 152, 153, 150, 145, -1000};
cc = ClusterClassify[data, Method -> "DBSCAN"]
Noise points are labeled as Missing["Anomalous"]:
cc[data]Options (7)
DistanceFunction (1)
Cluster string data using edit distance:
FindClusters[{"abc", "xyz", "bca", "wxyz"}, Method -> "DBSCAN", DistanceFunction -> EditDistance]Cluster data using Manhattan distance:
FindClusters[{{2, 3}, {5, 10}, {4, 5}, {2, 2}}, Method -> "DBSCAN", DistanceFunction -> ManhattanDistance]"NeighborhoodRadius" (2)
Find clusters by specifying the "NeighborhoodRadius" suboption:
FindClusters[{1, 2, 10, 12, 3, 1, 13, 25}, Method -> {"DBSCAN", "NeighborhoodRadius" -> 1}]Define a set of two-dimensional data points, characterized by four somewhat nebulous clusters:
dn1 = MultinormalDistribution[{4, 4}, {{2, 1 / 3}, {1 / 3, 2 / 3}}];
dn2 = MultinormalDistribution[{-3, -3}, {{2, -1 / 3}, {-1 / 3, 2 / 3}}];
dn3 = MultinormalDistribution[{4, -4}, {{2, -1 / 3}, {-1 / 3, 2 / 3}}];
dn4 = MultinormalDistribution[{-3, 4}, {{2, -1 / 3}, {-1 / 3, 2 / 3}}];
data = RandomVariate[MixtureDistribution[{1, 1, 1, 1}, {dn1, dn2, dn3, dn4}], 400];

ListPlot[data]
Plot clusters in data found using the "DBSCAN" method:
ListPlot[FindClusters[data, Method -> "DBSCAN"]]Plot different clusterings of data using the "DBSCAN" method by varying the "NeighborhoodRadius":
table = Table[ListPlot[FindClusters[data, Method -> {"DBSCAN", "NeighborhoodRadius" -> p}]], {p, {0.1, 0.2, 0.3}}];
	Grid[{table}, Frame -> All]
"NeighborsNumber" (3)
Find clusters by specifying the "NeighborsNumber" suboption:
FindClusters[{1, 2, 10, 12, 3, 1, 13, 25, 30, 32}, Method -> {"DBSCAN", "NeighborsNumber" -> 3}]data = Join[RandomReal[1, {100, 2}], RandomReal[{-3, -.1}, {100, 2}]];
ListPlot[data]Plot clusters in data found using the "DBSCAN" method:
ListPlot[FindClusters[data, Method -> "DBSCAN"]]Plot different clusterings of data using the "DBSCAN" method by varying the "NeighborsNumber":
table = Table[ListPlot[FindClusters[data, Method -> {"DBSCAN", "NeighborsNumber" -> p}]], {p, {3, 5, 10}}];
Grid[{table}, Frame -> All]
Define a set of two-dimensional data points, characterized by four somewhat nebulous clusters:
dn1 = MultinormalDistribution[{4, 4}, {{2, 1 / 3}, {1 / 3, 2 / 3}}];
dn2 = MultinormalDistribution[{-3, -3}, {{2, -1 / 3}, {-1 / 3, 2 / 3}}];
dn3 = MultinormalDistribution[{4, -4}, {{2, -1 / 3}, {-1 / 3, 2 / 3}}];
dn4 = MultinormalDistribution[{-3, 4}, {{2, -1 / 3}, {-1 / 3, 2 / 3}}];
data = RandomVariate[MixtureDistribution[{1, 1, 1, 1}, {dn1, dn2, dn3, dn4}], 400];

ListPlot[data]
Plot clusters in data using the "DBSCAN" method:
ListPlot[FindClusters[data, Method -> "DBSCAN"]]Plot different clusterings of data using the "DBSCAN" method by varying the "NeighborsNumber":
table = Table[ListPlot[FindClusters[data, Method -> {"DBSCAN", "NeighborsNumber" -> p}]], {p, {5, 30, 50}}];
Grid[{table}, Frame -> All]
"DropAnomalousValues" (1)
Train the ClassifierFunction, which labels outliers as Missing["Anomalous"]:
ndata = {1000, 1, 2, 3, 1.1, 2, 9, 8, 7, 6, 4, 1, .5, 152, 153, 150, 145, -1000};
cc = ClusterClassify[ndata, Method -> "DBSCAN"]
Use the trained ClassifierFunction to identify the outliers:
cc[ndata]Train the ClassifierFunction by dropping outliers and finding new cluster assignments:
cc = ClusterClassify[ndata, Method -> {"DBSCAN", "DropAnomalousValues" -> True}]
cc[ndata]
Similarly, find clusters of nearby values with outliers:
FindClusters[ndata, Method -> "DBSCAN"]Remove outliers using the "DropAnomalousValues" suboption:
FindClusters[ndata, Method -> {"DBSCAN", "DropAnomalousValues" -> True}]