"JarvisPatrick" (Machine Learning Method)
- Method for FindClusters, ClusterClassify and ClusteringComponents.
- Partitions data into clusters of similar elements using Jarvis–Patrick clustering.
Details & Suboptions
- "JarvisPatrick" is a neighbor-based clustering method. "JarvisPatrick" works for arbitrary cluster shapes and sizes. However, it is parameter sensitive, and can fail when clusters have different densities or are loosely connected.
- The following plots show the results of the "JarvisPatrick" method applied to toy datasets:
-
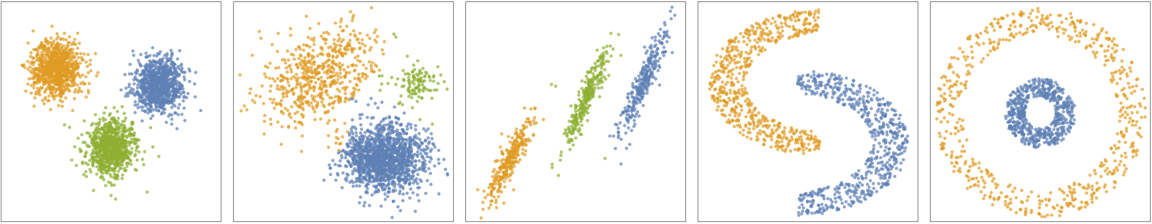
- The algorithm finds clusters based on the similarity of nearest neighbors of data points, and uses "shared nearest neighbors" as a measure of similarity between points.
- In "JarvisPatrick", neighbors are defined by points within a ball of ϵ radius. Each couple of neighbors that share at least p neighbors belong to the same cluster.
- The following suboptions can be given:
-
"NeighborhoodRadius" Automatic radius ϵ "SharedNeighborsNumber" Automatic minimum number of shared neighbors p
Examples
open all close allBasic Examples (2)
Find clusters of nearby values using the "JarvisPatrick" method:
FindClusters[{1, 2, 10, 12, 3, 1, 13, 25}, Method -> "JarvisPatrick"]SeedRandom[123];
data = Join[RandomReal[1, {100, 2}], RandomReal[{-3, -.1}, {100, 2}]];
ListPlot[data]
Plot clusters in data found using the "JarvisPatrick" method:
ListPlot[FindClusters[data, Method -> "JarvisPatrick"]]Options (5)
DistanceFunction (1)
"NeighborhoodRadius" (2)
Find clusters using "JarvisPatrick":
FindClusters[{1, 2, 10, 12, 3, 1, 13, 25, 26}, Method -> "JarvisPatrick"]Find clusters by specifying the "NeighborhoodRadius" suboption:
FindClusters[{1, 2, 10, 12, 3, 1, 13, 25, 26}, Method -> {"JarvisPatrick", "NeighborhoodRadius" -> 0.5}]Define a set of two-dimensional data points, characterized by four somewhat nebulous clusters:
data = Join[RandomReal[1, {100, 2}], RandomReal[{-3, -.1}, {100, 2}]];
ListPlot[data]Plot different clusterings of the data using the "JarvisPatrick" method by varying the "NeighborhoodRadius":
table = Table[ListPlot[FindClusters[data, Method -> {"JarvisPatrick", "NeighborhoodRadius" -> p}]], {p, {0.1, 0.2, 0.3}}];
	Grid[{table}, Frame -> All]
"SharedNeighborsNumber" (2)
Find clusters by varying "NeighborsNumber" suboptions:
FindClusters[{{0, 0}, {1, 1}, {1, 0}, {2, 2}, {10, 11}, {12, 13}, {3, 3}, {25, 26}}, Method -> {"JarvisPatrick", "SharedNeighborsNumber" -> #}]& /@ {2, 3}SeedRandom[123];
data = Join[RandomReal[{0.5, 2}, {100, 2}], RandomReal[{-3, -0.1}, {500, 2}]];
ListPlot[data]Plot clustering of data points using the "JarvisPatrick" method by varying the "SharedNeighborsNumber":
ListPlot[FindClusters[data, Method -> {"JarvisPatrick", "SharedNeighborsNumber" -> 10}]]Applications (1)
Create and visualize noisy 2D moon-shaped training and test datasets:
circle[r_, theta_] := {r Sin[theta], r Cos[theta]};
SeedRandom[77];
{train, test} = With[{
	rot = RotationTransform[π, {0, 0}],
	tra = TranslationTransform[{1, 2.5}], pts = circle@@@RandomVariate[UniformDistribution[{{2, 3}, {0, Pi}}], 2000]},
	TakeDrop[RandomSample@Join[tra[rot[pts]], pts], 2000]
	];
ListPlot[{train, test}, PlotRange -> All, AspectRatio -> 1, PlotStyle -> Directive[ PointSize[0.013], Opacity[0.7]], Frame -> True, Axes -> False]
Train various ClassifierFunctions by varying the "NeighborhoodRadius" using the "JarvisPatrick" method:
nrad = {0.1, 0.2, 0.5};
	cls = ClusterClassify[train, Method -> {"JarvisPatrick", "NeighborhoodRadius" -> #}]& /@ nrad;
Find and visualize different clusterings of the test set, given small changes in "NeighborhoodRadius":
decision = (#[test])& /@ cls;
	clsR = Range[Length[Information[#, "Classes"]]]& /@ cls;

	Grid[{Table[ListPlot[
	Pick[test, decision[[i]], #]& /@ clsR[[i]],
	PlotStyle -> Directive[PointSize[0.025], Opacity[0.7]], AspectRatio -> 1, Frame -> True, Axes -> False, PlotLabel -> "NRadius=" <> ToString@nrad[[i]] ]
	, {i, 1, Length@cls}]}, Frame -> All]