

BarabasiAlbertGraphDistribution
BarabasiAlbertGraphDistribution[n,k]
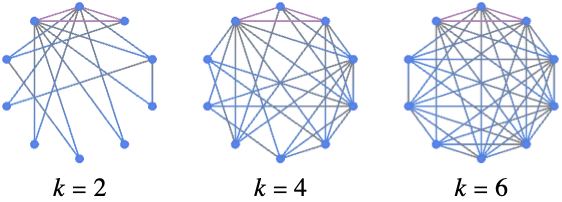
represents a Barabasi–Albert graph distribution for n-vertex graphs where a new vertex with k edges is added at each step.
Details
- BarabasiAlbertGraphDistribution is also known as scale-free graph distribution.
- The BarabasiAlbertGraphDistribution is constructed starting from CycleGraph[3], and a vertex with k edges is added at each step. The k edges are attached to vertices at random, following a distribution proportional to the vertex degree.
- BarabasiAlbertGraphDistribution can be used with such functions as RandomGraph and GraphPropertyDistribution.
Examples
open all close allBasic Examples (2)
Generate a pseudorandom graph:
RandomGraph[BarabasiAlbertGraphDistribution[30, 2]]RandomGraph[BarabasiAlbertGraphDistribution[10 ^ 4, 2]];EmpiricalDistribution[VertexDegree[%]]DiscretePlot[PDF[%, k], {k, 7, 30}]Scope (3)
Generate simple undirected graphs:
RandomGraph[BarabasiAlbertGraphDistribution[10, 3]]Generate a set of pseudorandom graphs:
RandomGraph[BarabasiAlbertGraphDistribution[10, 3], 4]Compute probabilities and statistical properties:
𝒟 = GraphPropertyDistribution[VertexDegree[g, 1], gBarabasiAlbertGraphDistribution[30, 4]];NProbability[x ≥ 10, x𝒟]Applications (3)
The internet at the level of autonomous systems can be modeled with BarabasiAlbertGraphDistribution:
g = ExampleData[{"NetworkGraph", "Internet"}];𝒢 = BarabasiAlbertGraphDistribution[VertexCount[g], Round[EdgeCount[g] / VertexCount[g]]]The model captures the power-law nature of the empirical degree distribution:
{Histogram[VertexDegree[g], {"Log", 10}, {"Log", "PDF"}], Histogram[VertexDegree[RandomGraph[𝒢]], {"Log", 10}, {"Log", "PDF"}]}The model has a lower clustering coefficient:
N[GlobalClusteringCoefficient[RandomGraph[𝒢]]]N[GlobalClusteringCoefficient[g]]Use the Barabasi–Albert graph distribution as a model of the Western States Power Grid network:
g = ExampleData[{"NetworkGraph", "PowerGrid"}];𝒢 = BarabasiAlbertGraphDistribution[VertexCount[g], Round[EdgeCount[g] / VertexCount[g]]]The model captures the power-law nature of the empirical degree distribution:
f[g_] := Map[{#[[1]], #[[2]] / VertexCount[g]}&, Tally[VertexDegree[g]]];{ListLogLogPlot[f[g]], ListLogLogPlot[f[RandomGraph[𝒢]]]}A social network with 400 people and prominent hubs is modeled with BarabasiAlbertGraphDistribution. Find the expected number of ties separating a person at the hub from the most remote person in the network:
𝒟 = GraphPropertyDistribution[VertexEccentricity[g, First[GraphHub[g]]], gBarabasiAlbertGraphDistribution[400, 3]];NExpectation[x, x𝒟]Properties & Relations (5)
Distribution of the number of vertices:
GraphPropertyDistribution[VertexCount[g], gBarabasiAlbertGraphDistribution[n, k]]Distribution of the number of edges:
GraphPropertyDistribution[EdgeCount[g], gBarabasiAlbertGraphDistribution[n, k]]𝒟[n_, k_] := EmpiricalDistribution[VertexDegree[RandomGraph[BarabasiAlbertGraphDistribution[n, k]]]];The distribution can be approximated by ZipfDistribution:
ℰ = TruncatedDistribution[{5, ∞}, ZipfDistribution[2]];DiscretePlot[Evaluate[{PDF[𝒟[10 ^ 4, 6], d], PDF[ℰ, d]}], {d, 7, 25}, Joined -> True]The degree distribution follows a power law:
PDF[ℰ, d]Use RandomSample to simulate a BarabasiAlbertGraphDistribution:
barabasi[n_, k_] /; n ≤ k + 1 := CompleteGraph[n]barabasi[n_, k_] /; n > k + 1 := Module[{g = barabasi[n - 1, k]},
Graph[Join[EdgeList[g], Map[n#&, RandomSample[VertexDegree[g] -> VertexList[g], k]]]]]Table[barabasi[n, 2], {n, 4, 7}]In BarabasiAlbertGraphDistribution[n,k], there is a maximum clique of size k+1:
RandomGraph[BarabasiAlbertGraphDistribution[8, 3]]FindClique[%]Text
Wolfram Research (2010), BarabasiAlbertGraphDistribution, Wolfram Language function, https://reference.wolfram.com/language/ref/BarabasiAlbertGraphDistribution.html.
CMS
Wolfram Language. 2010. "BarabasiAlbertGraphDistribution." Wolfram Language & System Documentation Center. Wolfram Research. https://reference.wolfram.com/language/ref/BarabasiAlbertGraphDistribution.html.
APA
Wolfram Language. (2010). BarabasiAlbertGraphDistribution. Wolfram Language & System Documentation Center. Retrieved from https://reference.wolfram.com/language/ref/BarabasiAlbertGraphDistribution.html