

BernoulliGraphDistribution
BernoulliGraphDistribution[n,p]
represents a Bernoulli graph distribution for n-vertex graphs with edge probability p.
Details and Options
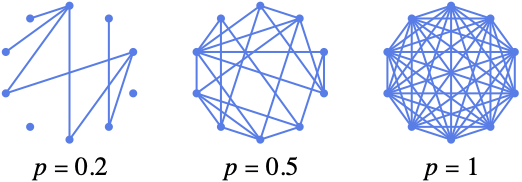
- The Bernoulli graph is constructed starting with the complete graph with n vertices and selecting each edge independently through a Bernoulli trial with probability p.
- The following options can be given:
-
DirectedEdges False whether to generate directed edges - BernoulliGraphDistribution can be used with such functions as RandomGraph and GraphPropertyDistribution.
Examples
open all close allBasic Examples (2)
Generate a pseudorandom graph:
RandomGraph[BernoulliGraphDistribution[10, 0.6]]Distribution of the number of edges:
𝒟[n_, p_] = GraphPropertyDistribution[EdgeCount[g], gBernoulliGraphDistribution[n, p]]PDF[𝒟[n, p], m]DiscretePlot[Evaluate @ Table[PDF[𝒟[n, 1 / 2], m], {n, 3, 12, 3}], {m, 0, 50}, PlotRange -> All, ExtentSize -> 1 / 2]Scope (4)
Generate simple undirected graphs:
RandomGraph[BernoulliGraphDistribution[5, 0.6]]RandomGraph[BernoulliGraphDistribution[5, 0.6, DirectedEdges -> True]]Generate a set of pseudorandom graphs:
RandomGraph[BernoulliGraphDistribution[5, 0.8], 4]Compute probabilities and statistical properties:
𝒟 = GraphPropertyDistribution[GlobalClusteringCoefficient[g], gBernoulliGraphDistribution[5, 0.4]];N[Mean[𝒟]]Options (2)
DirectedEdges (2)
By default, a Bernoulli graph is undirected:
RandomGraph[BernoulliGraphDistribution[10, 0.3]]UndirectedGraphQ[%]With the setting DirectedEdges->True, directed Bernoulli graphs are generated:
RandomGraph[BernoulliGraphDistribution[10, 0.3, DirectedEdges -> True]]DirectedGraphQ[%]Applications (3)
After 20 children have spent their first week in kindergarten, the probability that two children have made friends is 0.2:
𝒢 = BernoulliGraphDistribution[20, 0.2];RandomGraph[𝒢]Find the probability that the social network is connected:
NProbability[x == 1, xGraphPropertyDistribution[Boole[ConnectedGraphQ[g]], g𝒢]]In a snowball fight with 15 participants, and everybody throwing snowballs at everyone else, the probability of being hit by any given participant is 0.4:
𝒢 = BernoulliGraphDistribution[15, 0.4, DirectedEdges -> True];RandomGraph[𝒢]Find the size of the largest group where everybody has been hit by everyone else:
Length[First[FindClique[%]]]Find the largest component fraction when the mean vertex degree is ![]() :
:
𝒟[n_, β_] := GraphPropertyDistribution[Length[First[ConnectedComponents[g]]] / n, gBernoulliGraphDistribution[n, β / (n - 1)]]Table[RandomVariate[𝒟[10, β]], {β, 0, 3}]Average the result over 100 runs and plot it for different numbers of vertices:
Table[Plot[Mean[RandomVariate[𝒟[10, β], 100]], {β, 0, 3}, MaxRecursion -> 2, PlotLabel -> n], {n, {10, 100}}]Properties & Relations (6)
Distribution of the number of vertices:
GraphPropertyDistribution[VertexCount[g], gBernoulliGraphDistribution[n, p]]Distribution of the number of edges:
𝒟[n_, p_] = GraphPropertyDistribution[EdgeCount[g], gBernoulliGraphDistribution[n, p]]PDF[𝒟[n, p], m]DiscretePlot[Evaluate @ Table[PDF[𝒟[n, 0.4], x], {n, 3, 12, 3}], {x, 0, 40}, PlotRange -> All, ExtentSize -> 1 / 2]The mean of the number of edges:
Mean[𝒟[n, p]]Distribution of the degree of a vertex:
𝒟[n_, p_] = GraphPropertyDistribution[VertexDegree[g, v], gBernoulliGraphDistribution[n, p]]PDF[𝒟[n, p], k]DiscretePlot[Evaluate @ Table[PDF[𝒟[n, 0.3], x], {n, 5, 50, 15}], {x, 0, 25}, PlotRange -> All, ExtentSize -> 1 / 2]The mean of the degree of a vertex:
Mean[𝒟[n, p]]Connectivity for large n with respect to p:
𝒟[n_, p_] := GraphPropertyDistribution[Boole[ConnectedGraphQ[g]], gBernoulliGraphDistribution[n, p]]A Bernoulli graph is almost surely disconnected for ![]() :
:
NProbability[x == 0, x𝒟[500, 0.01], Method -> {"MonteCarlo", PrecisionGoal -> 1}]A Bernoulli graph is almost surely connected for ![]() :
:
NProbability[x == 1, x𝒟[500, 0.02], Method -> {"MonteCarlo", PrecisionGoal -> 1}]Use BernoulliDistribution to simulate a BernoulliGraphDistribution:
bernoulli[n_, p_] :=
	Graph[Range[n], Pick[EdgeList[CompleteGraph[n]],
RandomVariate[BernoulliDistribution[p], n(n - 1) / 2], 1]]Table[bernoulli[10, p], {p, 0.3, 1, 0.2}]Edge probability 1 results in the CompleteGraph:
RandomGraph[BernoulliGraphDistribution[5, 1]]CompleteGraphQ[%]Edge probability 0 results in the empty graph:
RandomGraph[BernoulliGraphDistribution[5, 0]]EmptyGraphQ[%]Text
Wolfram Research (2010), BernoulliGraphDistribution, Wolfram Language function, https://reference.wolfram.com/language/ref/BernoulliGraphDistribution.html.
CMS
Wolfram Language. 2010. "BernoulliGraphDistribution." Wolfram Language & System Documentation Center. Wolfram Research. https://reference.wolfram.com/language/ref/BernoulliGraphDistribution.html.
APA
Wolfram Language. (2010). BernoulliGraphDistribution. Wolfram Language & System Documentation Center. Retrieved from https://reference.wolfram.com/language/ref/BernoulliGraphDistribution.html