

DirectedEdges
Details
- DirectedEdges->True specifies that edges should be directed.
- DirectedEdges->False specifies that edges should be undirected.
Examples
open all close allBasic Examples (5)
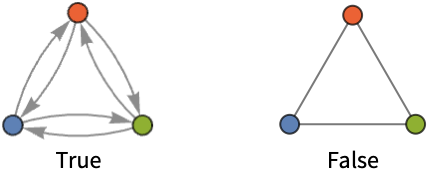
By default rules are taken to be directed edges:
Graph[{1 -> 2, 2 -> 3, 3 -> 1}]Graph[{1 -> 2, 2 -> 3, 3 -> 1}, DirectedEdges -> False]Obtain a CycleGraph with directed edges:
CycleGraph[6, DirectedEdges -> True]Create a directed graph from a symmetric adjacency matrix:
AdjacencyGraph[(|   |   |   |
| - | - | - |
| 0 | 1 | 1 |
| 1 | 0 | 1 |
| 1 | 1 | 0 |), DirectedEdges -> True]
Show edges as arrows in GraphPlot:
GraphPlot[{1 -> 2, 2 -> 3, 3 -> 4, 4 -> 1, 2 -> 4, 4 -> 5, 4 -> 6}, DirectedEdges -> True]Do not show edges as arrows in LayeredGraphPlot:
LayeredGraphPlot[{1 -> 2, 2 -> 3, 3 -> 4, 4 -> 1, 2 -> 4, 4 -> 5, 4 -> 6}, DirectedEdges -> False]Scope (5)
DirectedEdges is an option to special graph constructors including PathGraph:
PathGraph[Range[4], DirectedEdges -> True]CompleteGraph, GridGraph, and ButterflyGraph:
{CompleteGraph[5, DirectedEdges -> True], GridGraph[{2, 3}, DirectedEdges -> True], ButterflyGraph[2, DirectedEdges -> True]}CycleGraph, StarGraph, and WheelGraph:
{CycleGraph[7, DirectedEdges -> True], StarGraph[6, DirectedEdges -> True], WheelGraph[6, DirectedEdges -> True]}CompleteKaryTree and KaryTree:
{CompleteKaryTree[3, 2, DirectedEdges -> True], KaryTree[6, 3, DirectedEdges -> True]}DirectedEdges->True prevents AdjacencyGraph from creating undirected graphs:
AdjacencyGraph[(|   |   |   |
| - | - | - |
| 0 | 1 | 1 |
| 1 | 0 | 1 |
| 1 | 1 | 0 |), DirectedEdges -> True]WeightedAdjacencyGraph[(| | | | |
| - | - | - | - |
| ∞ | 1 | 2 | ∞ |
| 1 | ∞ | 1 | 1 |
| 2 | 1 | ∞ | 3 |
| ∞ | 1 | 3 | ∞ |), DirectedEdges -> True]DirectedEdges works with RandomGraph and UniformGraphDistribution:
RandomGraph[UniformGraphDistribution[5, 6], DirectedEdges -> True]RandomGraph[BernoulliGraphDistribution[5, 0.6], DirectedEdges -> True]By default, edges are shown as lines in GraphPlot and TreePlot:
GraphPlot[{1 -> 2, 2 -> 3, 3 -> 4, 4 -> 1, 2 -> 4}]GraphPlot[{1 -> 2, 2 -> 3, 3 -> 4, 4 -> 1, 2 -> 4}, DirectedEdges -> True]By default, edges are shown as arrows in LayeredGraphPlot:
LayeredGraphPlot[{1 -> 2, 2 -> 3, 3 -> 4, 1 -> 4, 2 -> 5}]LayeredGraphPlot[{1 -> 2, 2 -> 3, 3 -> 4, 1 -> 4, 2 -> 5}, DirectedEdges -> False]Text
Wolfram Research (2007), DirectedEdges, Wolfram Language function, https://reference.wolfram.com/language/ref/DirectedEdges.html.
CMS
Wolfram Language. 2007. "DirectedEdges." Wolfram Language & System Documentation Center. Wolfram Research. https://reference.wolfram.com/language/ref/DirectedEdges.html.
APA
Wolfram Language. (2007). DirectedEdges. Wolfram Language & System Documentation Center. Retrieved from https://reference.wolfram.com/language/ref/DirectedEdges.html