

GeoVector
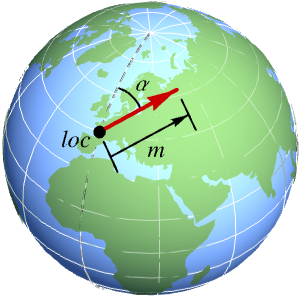
GeoVector[loc{m,α}]
represents a horizontal two-dimensional vector of magnitude m and bearing α at geo location loc.
GeoVector[loc{m,α,w}]
represents a three-dimensional vector of horizontal modulus m, bearing α and vertical component w at geo location loc.
GeoVector[{loc1,loc2,…}{vec1,vec2,…}]
represents a collection of vectors veci at respective geo locations loci.
GeoVector[{loc1vec1,loc2vec2,…}]
represents the same collection of vectors.
GeoVector[vec]
represents a geo vector whose associated location has been implicitly specified.
Details
- GeoVector[…] can represent any vectorial magnitude on the surface of the Earth or any other celestial globe, like wind speed, magnetic field, scalar gradient, etc.
- GeoVector describes vector data using an orthonormal frame tangent to the reference ellipsoid at the given location.
- In GeoVector[loc{m,α}], the vector modulus m can be given as a numeric expression or numeric Quantity object with any units. The bearing α can be given as a number of degrees or a Quantity angle, measured clockwise from north. The vertical component is assumed to be zero.
- In GeoVector[loc{m,α,w}], the horizontal modulus m and the vertical component w can be quantities, but their units must be compatible.
- In GeoVector[locvec], the location loc can be given as a {lat,lon} pair in degrees, a geo Entity object or any geo location object with head GeoPosition or similar.
- GeoVector[GeoVectorENU[…]] converts a vector in GeoVectorENU form to GeoVector form, and similarly for GeoVectorXYZ and GeoGridVector objects.
- GeoGraphics[GeoVector[locvec]] takes loc into account for geo range estimation, but does not display a vector. Use GeoGraphics[GeoMarker[GeoVector[locvec],vmarker]] to display a vector at the given location, styled as specified by the vector marker vmarker.
- GeoVector[…][prop] gives the specified property of a geo vector.
- Possible properties include:
-
"Count" number of vectors in the GeoVector object "Data" first argument of the GeoVector object "Depth" vector depth: 0 for a single vector, 1 for a list of them, … "Location" location data of the GeoVector object "LocationDimension" number of coordinates for each position "LocationPackingType" Integer or Real if positions are packed; None otherwise "Vector" vector data of the GeoVector object "VectorDimension" number of components for each vector "VectorPackingType" Integer or Real if vectors are packed; None otherwise
Examples
open all close allBasic Examples (3)
Take current wind data near your location:
gv = WindVectorData[Here, Now, "DownwindGeoVector"]Place a dart with such direction in a local map of your area:
GeoGraphics[GeoMarker[gv, {"Dart", "Circle"}]]Show the direction in a world map with a different geo projection, using a smaller dart:
GeoGraphics[GeoMarker[gv, {"Dart", "Circle"}, "Scale" -> 0.5], GeoRange -> "World", GeoProjection -> "Bonne", GeoGridLines -> Automatic, GeoBackground -> "Plain"]Get data about the Earth's magnetic field vector at Anchorage:
GeomagneticModelData[Entity["City", {"Anchorage", "Alaska", "UnitedStates"}]]The horizontal component, declination and negative of the down component form a GeoVector object:
GeomagneticModelData[Entity["City", {"Anchorage", "Alaska", "UnitedStates"}], GeoVector]Transform that geo vector to its Cartesian form along the east-north-up axes:
GeoVectorENU[%]Transform back to cylindrical form:
GeoVector[%]Draw arrows at random locations over the world, always pointing in the north direction:
gv = GeoVector[RandomGeoPosition["World", 100] -> Table[{1, 0}, 100]]GeoGraphics[GeoMarker[gv], GeoProjection -> "LambertAzimuthal", GeoGridLines -> Automatic, GeoRange -> "World"]Use GeoVectorPlot for a smoother representation:
GeoVectorPlot[gv, GeoProjection -> "LambertAzimuthal", GeoRange -> "World"]Scope (8)
Data Specification (4)
Specify the location of a geo vector as a {lat,lon} pair in degrees:
GeoVector[{20, -50} -> {1, 0}]Construct a horizontal velocity vector with 60 degrees bearing at Chicago:
gv = GeoVector[Entity["City", {"Chicago", "Illinois", "UnitedStates"}] -> {Quantity[100, "Miles" / "Hours"], 60}]Rewrite the location as a geo position object with any head:
GeoPosition[gv]GeoPositionXYZ[gv]GeoGridPosition[gv, "Mercator"]Anything that can be interpreted by GeoPosition can be used as a location:
GeoVector["12d 3m 4.5s N, 123d 58m 3.2s W" -> {1, 45}]//GeoPositionGeoVector["NullIsland" -> {2, 33}]//GeoPositionWork with horizontal 2D vectors with a non-negative modulus of any unit dimension:
GeoVector[{20, -50} -> {1, 0}]GeoVector[{20, -50} -> {Quantity[2, "Meters" / "Seconds"], 130}]GeoVector[{20, -50} -> {Quantity[4, "Meters" / "Seconds" ^ 2], 130}]Bearings can be given as a number of degrees or as a Quantity angle:
GeoVector[{20, -50} -> {Quantity[2, "Meters" / "Seconds"], Quantity[130, "AngularDegrees"]}]GeoVector[{20, -50} -> {Quantity[2, "Meters" / "Seconds"], Quantity[2, "Radians"]}]Geo Vector Arrays (3)
Specify wind data simultaneously for several locations:
GeoVector[{Entity["City", {"London", "GreaterLondon", "UnitedKingdom"}], Entity["City", {"Paris", "IleDeFrance", "France"}], Entity["City", {"Amsterdam", "NoordHolland", "Netherlands"}], Entity["City", {"Berlin", "Berlin", "Germany"}]} -> {{Quantity[5.8, "Miles"/"Hours"], -130.}, {Quantity[6.3, "Miles"/"Hours"], 70.}, {Quantity[10.3, "Miles"/"Hours"], -150.}, {Quantity[6.9, "Miles"/"Hours"], -100.}}]The same input can also be expressed as:
GeoVector[{Entity["City", {"London", "GreaterLondon", "UnitedKingdom"}] -> {Quantity[5.8, "Miles"/"Hours"], -130.}, Entity["City", {"Paris", "IleDeFrance", "France"}] -> {Quantity[6.3, "Miles"/"Hours"], 70.}, Entity["City", {"Amsterdam", "NoordHolland", "Netherlands"}] -> {Quantity[10.3, "Miles"/"Hours"], -150.}, Entity["City", {"Berlin", "Berlin", "Germany"}] -> {Quantity[6.9, "Miles"/"Hours"], -100.}}]Represent those wind directions in a map:
GeoGraphics[GeoMarker[%, {"Dart", "Circle"}], GeoRange -> {{47, 54}, {-2, 16}}]Generate a million random Cartesian vectors at respective random locations:
gvenu = GeoVectorENU[RandomGeoPosition[10 ^ 6] -> QuantityArray[RandomReal[{-1, 1}, {10 ^ 6, 2}], "Meters"]]GeoVector can process them efficiently:
AbsoluteTiming[gv = GeoVector[gvenu]]Transform back to their Cartesian form:
AbsoluteTiming[newgvenu = GeoVectorENU[gv]]Check that the difference is just numerical error:
CoordinateBounds[newgvenu["Vector"] - gvenu["Vector"]]Take the locations of the capital cities of the UN countries:
capitals = GeoPosition[EntityClass["Country", "UnitedNations"]["CapitalCity"]]vecs = QuantityArray[RandomReal[360, {193, 2}], {"Meters" / "Seconds", "AngularDegrees"}]Construct random vectors at those locations:
gv = GeoVector[capitals -> vecs]Convert to local Cartesian form:
GeoVectorENU[gv]GeoVector[%]Data Extraction (1)
A horizontal velocity vector with 60 degrees bearing at Chicago:
gv = GeoVector[Entity["City", {"Chicago", "Illinois", "UnitedStates"}] -> {Quantity[100, "Miles" / "Hours"], 60}]Extract the location of the geo vector:
gv["Location"]Extract the vector data from the geo vector:
gv["Vector"]gv["LocationVectorRule"]gv["Properties"]AssociationMap[gv, %]//Normal//ColumnApplications (1)
Get vector field data for 100 random locations over Canada:
locs = RandomGeoPosition[Entity["Country", "Canada"], 100]They roughly point north, but there is some variability:
gv = GeoVector[GeomagneticModelData[locs, Now, GeoVector]]Represent the horizontal part of those vectors in a cylindrical projection, for which the y axis points toward true north:
GeoGraphics[GeoMarker[gv], GeoProjection -> "Mercator", GeoGridLines -> Automatic, GeoBackground -> "Plain"]Properties & Relations (4)
The same vector data at different locations represents different 3D vectors:
gv1 = GeoVector[Entity["City", {"Paris", "IleDeFrance", "France"}] -> {1, 45}];gv2 = GeoVector[Entity["City", {"BuenosAires", "BuenosAires", "Argentina"}] -> {1, 45}];GeoVectorXYZ /@ {gv1, gv2}Identical vertical vectors at antipodal locations are opposite each other as 3D vectors:
gv1 = GeoVector[Here -> {0, 0, 1}]gv2 = GeoVector[GeoAntipode[Here] -> {0, 0, 1}]GeoVectorXYZ[gv1]["Vector"]GeoVectorXYZ[gv2]["Vector"] == -%This is an acceleration vector at the location of the Eiffel Tower:
GeoVector[Entity["Building", "EiffelTower::5h9w8"] -> {Quantity[5, "Meters"/"Seconds"^2], 30}]Convert into a vector in the Mercator projection:
GeoGridVector[%, "Mercator"]Transform back to GeoVector form:
GeoVector[%]Interactive Examples (2)
Compare a geo vector and a geodesic starting from the same location with the same azimuth:
Manipulate[GeoGraphics[{GeoCircle[Entity["City", {"Chicago", "Illinois", "UnitedStates"}], Quantity[3000, "Miles"]], Arrow@GeoPath[{Entity["City", {"Chicago", "Illinois", "UnitedStates"}], Quantity[3000, "Miles"], α}], GeoMarker[GeoVector[Entity["City", {"Chicago", "Illinois", "UnitedStates"}] -> {1, α}], Placed["Dart", "Start"]]}, GeoProjection -> "Equirectangular"], {{α, 0}, -180, 180}]Draw the north and east directions at a chosen location, and a vector at that same location:
Manipulate[GeoGraphics[{PointSize[Large], Point[GeoPosition[{lat, lon}]], GeoMarker[GeoVector[{GeoPosition[{lat, lon}] -> {1, 0}, GeoPosition[{lat, lon}] -> {1, 90}}], Placed["Arrow", "Start"], "Color" -> Green, "Scale" -> 0.7], GeoMarker[GeoVector[{GeoPosition[{lat, lon}] -> {2, bearing}}], Placed["Arrow", "Start"]], GeoPath["Greenwich"], GeoPath["Equator"]}, GeoRange -> "World", GeoProjection -> {"Orthographic", "Centering" -> {40, 25}, "PreserveVectorNorm" -> pn}, GeoGridLines -> Automatic, GeoBackground -> None], {{lat, 45, "Latitude"}, -90, 90}, {{lon, 60, "Longitude"}, -180, 180}, {{bearing, 60, "Bearing"}, -180, 180}, {{pn, True, "Preserve norm"}, {True, False}}]Text
Wolfram Research (2019), GeoVector, Wolfram Language function, https://reference.wolfram.com/language/ref/GeoVector.html.
CMS
Wolfram Language. 2019. "GeoVector." Wolfram Language & System Documentation Center. Wolfram Research. https://reference.wolfram.com/language/ref/GeoVector.html.
APA
Wolfram Language. (2019). GeoVector. Wolfram Language & System Documentation Center. Retrieved from https://reference.wolfram.com/language/ref/GeoVector.html