


ModelFitReport
represents a symbolic fit report obtained from functions like ModelFit.
ModelFitReport[…][prop]
extracts a property from the report.
Details
- ModelFitReport represents a report containing model selection results, fit metrics, cross-validation results and classical inference for models fitted with ModelFit.
- Reports can be returned from functions such as the "Report" property of ModelFit.
- When a single model is passed to ModelFit, the report contains diagnostics for that model only.
- When multiple models or hyperparameter ranges are given, ModelFit performs cross-validation to select the best model, and the report additionally contains cross-validation metrics, model rankings and a comparison chart.
- Properties of a fit report are obtained from ModelFitReport[…]["property"].
- ModelFitReport[…][{prop1,…}] gives several properties at once.
- Best model properties include:
-
"BestModel" best fitted model "Expression" symbolic expression of the best model "Function" best fit pure function "TabularFunction" pure function operating on a row or list input - "Expression", "Function" and "TabularFunction" are only available for models with base type "Formula" or "Linear".
- Model and data introspection properties include:
-
"Name" model type name "BaseType" "Linear", "Formula" or model-specific "Hyperparameters" hyperparameter settings of the best model "HyperparameterDomain" domain searched during model selection "HyperparameterDefaultDomain" default domain for the hyperparameters "Variables" variable symbols "ColumnNames" column names of the training data "ColumnVariableMap" column-to-variable mapping "VariableColumnMap" variable-to-column mapping "Schema" data type schema "InputSize" number of input dimensions "OutputSize" number of output dimensions "InputType" data types of input "OutputType" data types of output "Task" inferred task (e.g. "Regression") "Constraints" structural constraints on the model "Weights" weights applied to data points - Parameter properties include:
-
"Parameters" parameter symbols "ParameterNames" parameter names "ParameterValues" fitted parameter values "ParameterAssociation" parameter name-value association "ParameterRules" fitted values as a list of rules "ParameterCount" number of parameters "EstimatedParameterCount" number of estimated parameters "ParameterInitialValues" initial values used for fitting - "ParameterValues" is available for every trained model. The other parameter properties are only available for models with base type "Formula" or "Linear".
- Fit summary properties include:
-
"TrainingLoss" training loss of the best model "CriterionFunction" loss function used for training "LossMetric" name of the loss metric "FitResiduals" difference between actual and predicted responses "TotalSumOfSquares" total sum of squares of the response "ResidualSumOfSquares" sum of squared residuals "MeanAbsoluteError" mean absolute error "MedianAbsoluteError" median absolute error "RootMeanSquaredError" root mean squared error "CoefficientOfVariation" coefficient of variation of residuals "TrainingTime" wall time spent training the best model "MemoryUsed" memory used while training the best model - Diagnostic plot properties include:
-
"ResidualHistogram" histogram of residuals with a fitted normal overlay "ResidualPlot" residuals against fitted values "ResidualTrendPlot" residuals against the predictor (1D inputs) "ProbabilityPlot" residual CDF against a normal CDF "QuantilePlot" residual quantiles against normal quantiles "ComparisonPlot" predicted versus actual response - Model selection and cross-validation properties include:
-
"Data" training data "Ordering" indices of models sorted by increasing loss "TotalTrainingTime" wall time training all candidates "TotalMemoryUsed" peak memory used during training "ValidationSet" validation set strategy used "CrossValidationData" per-candidate cross-validation results "CrossValidationChart" box-whisker chart of per-fold validation losses - "CrossValidationData" and "CrossValidationChart" are populated only when ValidationSet is not None, which is the default when multiple candidates are passed.
- Classical inference properties (for "Linear" and "Formula"–based models) include:
-
"RSquared" coefficient of determination 
"AdjustedRSquared"  adjusted for the number of parameters
"AIC" Akaike Information Criterion "AICc" finite-sample corrected AIC "BIC" Bayesian Information Criterion "LogLikelihood" log-likelihood of the fit "EstimatedVariance" estimate of the error variance "ANOVA" analysis-of-variance table "ParameterEstimates" estimates, standard errors, t-statistics, p-values, confidence intervals "BestFitParameters" parameter point estimates "CorrelationMatrix" parameter correlation matrix "CovarianceMatrix" parameter covariance matrix "HatDiagonal" diagonal of the hat (projection) matrix "PredictedResponse" fitted values for the training data "Response" observed response values "StandardizedResiduals" residuals scaled by the residual standard error "StudentizedResiduals" residuals scaled by single-deletion error estimates "MeanPredictions" confidence intervals for the mean prediction "MeanPredictionBands" bands for the mean prediction "SinglePredictions" confidence intervals for a single observation "SinglePredictionBands" bands for a single observation "BestFitAround" fitted function with mean uncertainty "BestFitDataAround" fitted function with predictive uncertainty "SymbolicExpression" symbolic expression of the fit - Additional properties only available for models with base type "Linear" include:
-
"Basis" basis used in the fit "BasisFunctions" basis functions used in the fit "DesignMatrix" design matrix "CatcherMatrix" catcher matrix "Eigenstructure" eigenstructure of the design matrix "DurbinWatsonD" Durbin-Watson statistic "ResidualDegreesOfFreedom" residual degrees of freedom "CookDistances" Cook's distance influence measures "DFFITS" DFFITS influence measures "BetaDifferences" DFBETAs "FitDifferences" fit differences "CovarianceRatios" covariance ratios "FVarianceRatios" F variance ratios "SingleDeletionVariances" single-deletion variance estimates "VarianceInflationFactors" variance inflation factors "ModelSumOfSquares" model sum of squares "AdjustedModelSumOfSquares" adjusted model sum of squares "MeanAdjustedTotalSumOfSquares" mean-adjusted total sum of squares "MeanAdjustedPredictedResponse" mean-adjusted fitted values "MeanAdjustedResponse" mean-adjusted response "MeanResponse" response mean "PartialSumOfSquares" type-III sum of squares "SequentialSumOfSquares" type-I sum of squares
Properties
Examples
open all close allBasic Examples (3)
Obtain a ModelFitReport from ModelFit:
report = ModelFit[ResourceData["Sample Data: Old Faithful Eruptions"], PolynomialModel[4], "Report"]Extract "RSquared" and the training loss:
report[{"RSquared", "TrainingLoss"}]Define a selection of model candidates:
models = {
	PolynomialModel[UpTo[3]],
	LinearModel[{x, y, x y}, {x, y}],
	DecisionTreeModel[],
	NearestModel[1 ;; 5 ;; 2]
	};
Fit the models on a dataset and get a report:
report = ModelFit[{...}, models, "Report"]report["BestModel"]The cross-validation chart compares all candidates:
report["CrossValidationChart"]Create a report from Tabular data:
report = ModelFit[Tabular[Association["RawSchema" -> Association["ColumnProperties" ->
     Association["Temperature" -> Association["ElementType" -> "Real64"],
      "Rainfall" -> Association["ElementType" -> "Real64"],
      "Yield" -> Association["ElementType" -> "Real64"]], "KeyColumns" -> None,
    "Backend" -> "WolframKernel"], "Options" -> {},
  "BackendData" -> Association["ColumnData" -> DataStructure["ColumnTable",
      {{TabularColumn[Association["Data" -> {{21.274363626077456, 32.638880243338534,
             16.996761168217887, 30.663352835710246, 18.88030101422309, 21.21262925923419,
             13.801297957058619, 11.9002324793208, 32.197362497036934, 13.138620238958067,
             20.241436236298547, 21.112424770120537, 27.405749954829002, 13.307665147300776,
             13.424766881234454, 20.97259531468952, 25.18424867059953, 23.26202816185207,
             10.465484058357424, 16.397097814615964, 13.851736373951308, 18.32927044981313,
             30.696173165707837, 32.9855949854575, 32.14478720052078, 12.651017398696625,
             23.083461287345894, 34.83768765056927, 20.00837101659612, 12.72758428193846,
             10.224240190287677, 12.586334627282277, 14.82690073071269, 32.395634205027555,
             16.689618755172628, 31.796694480507682, 25.342370637828978, 31.210772576037208,
             22.251263381886844, 18.573661910917895, 13.125532798463027, 16.427875268785666,
             19.919216818502896, 32.39752194507377, 27.9455305105966, 31.8345659691948,
             20.061383466930014, 13.856675506478668, 34.153026536410394, 34.207236449699984,
             15.630086799263257, 16.582434431126632, 23.461831632894768, 16.03816820252392,
             20.551299548385145, 34.788984802552996, 17.726487616668614, 33.28748205675713,
             17.149461015021235, 15.822643777764197, 13.671147642322909, 20.472197623158312,
             31.812583735185708, 16.17406055097594, 18.142207940290056, 33.21897402637236,
             26.44068116195821, 21.810469194900286, 12.743885714520838, 24.395056606648915,
             19.91093974334008, 23.213676738543654, 16.687082068575627, 16.44466906149443,
             31.115143818819206, 12.23240892693733, 17.75638688155034, 13.764972848588622,
             26.553872494639133, 18.876120690849458}, {}, None}, "ElementType" -> "Real64"]],
        TabularColumn[Association["Data" -> {{9.641212861989557, 60.953983058415396,
             49.55857318259782, 73.08996038457877, 61.97622275627821, 71.10900557684073,
             9.305672849447944, 28.628257611094178, 74.83625515113705, 7.501464391913437,
             3.2921016112529733, 53.855813103884145, 85.41559030515337, 93.75933792308055,
             31.794897478303994, 37.63213260921001, 36.85889833937892, 47.30996149289639,
             51.53080829230618, 57.37227415718489, 98.76250929730787, 78.79585017348663,
             10.295672147672574, 81.38868807229215, 84.5375407397281, 78.41964735938683,
             24.20222059876447, 34.835603055882316, 54.79341551350898, 96.55274708711241,
             86.54434859296872, 96.2875157486365, 17.57709919160082, 20.119406796064144,
             37.288637716131554, 14.722088486050676, 50.639173907559744, 32.9886610770556,
             8.441331794611418, 9.602548843183945, 78.62859077582974, 33.640710333037596,
             48.697354016643104, 20.92859568303109, 13.509542960452237, 16.904440666776853,
             83.73161565273561, 30.913664637940364, 7.482986030760741, 70.081801324632,
             36.77832787614701, 17.166739206123083, 9.64106130404283, 8.97530293927218,
             27.499282003188274, 29.619190255226325, 96.97525518824442, 30.168242584134177,
             77.8111185730686, 55.70406138847546, 25.07170986373495, 20.606698465518992,
             12.31988091780314, 7.9025824090340535, 82.15203413316654, 18.886118453183176,
             75.38676235567362, 36.1735308819459, 12.80356948738186, 31.05967465302284,
             45.73789203941334, 83.44539916208416, 20.450604094732938, 14.282053666309125,
             59.07195894458954, 97.39939819145363, 46.70388514536488, 41.869309499622574,
             82.49302603368773, 25.925568611194414}, {}, None}, "ElementType" -> "Real64"]],
        TabularColumn[Association["Data" -> {{45.08146625290131, 96.6233480166611,
             59.327113825731054, 91.85825808285469, 66.5110526006169, 77.19922598453354,
             32.64854973208589, 44.65511838395225, 97.86029555920695, 25.401312855755222,
             39.76399699776998, 65.70393611331286, 96.33997195790113, 71.97379585713982,
             42.37036288864871, 61.845611013121456, 68.64075765433721, 71.01270415338877,
             44.61551122390785, 58.802402969637335, 73.9472536362927, 73.64086592981765,
             63.3940898912315, 109.37841033261286, 108.53178099577192, 65.76034304590476,
             61.28796183675285, 86.8539823601026, 69.9449058949058, 76.72144418429458,
             63.818812477010155, 71.14487961376007, 38.20222764963004, 79.91412173098351,
             56.61322306333139, 78.61082331457568, 73.48401475615992, 73.25237867553318,
             50.23688599610344, 42.94680910126161, 65.92966250556978, 49.81892213265645,
             66.61745558525139, 73.46390082751718, 61.61915786105258, 70.7726730860374,
             81.59200223685298, 40.08401032223059, 69.20008390476359, 102.43121046909894,
             47.602257741215894, 44.027561373056635, 49.4892877491449, 28.319608016089923,
             54.4978507003262, 86.62962864217928, 84.34321749387686, 84.18221163933197,
             73.10760517869035, 57.78664124110287, 38.66126694156958, 49.330257789525646,
             64.97822415145333, 38.931114362893666, 75.56990446408443, 75.01933488318359,
             87.10594545788089, 60.28558949870267, 32.83710116288238, 62.83182860809156,
             62.75179120791623, 93.79015254438815, 44.173011036339744, 41.55780478724791,
             95.73246924040717, 75.40492466050038, 55.19997511406876, 46.23818801202954,
             100.35036661666152, 56.13170543835799}, {}, None}, "ElementType" -> "Real64"]]}}]]]] -> "Yield", PolynomialModel["Degree" -> 1], "Report"]
Compute a table with the best fit parameter properties:
report["ParameterEstimates"]Scope (11)
Property Access (1)
Fit a quadratic polynomial and create a report:
report = ModelFit[{1.27721, 6.81118, 16.3862, 27.3172, 45.7425, 66.5466, 91.6841, 120.329, 154.991, 192.26}, PolynomialModel[2], "Report"];report["RSquared"]Extract several properties at once:
report[{"AIC", "AICc", "BIC"}]List the available property names:
report["Properties"]//ShortBest Model (1)
Fit a linear model and create a report:
report = ModelFit[{...}, PolynomialModel[1], "Report"];Retrieve the best-fitted model:
report["BestModel"]report["Expression"]Get a pure function ready to evaluate:
report["Function"]Or a function that takes a row or list input:
report["TabularFunction"]Model and Data Introspection (1)
Fit a linear model on a tabular dataset with two predictors:
report = ModelFit[Tabular[Association["RawSchema" -> Association["ColumnProperties" ->
     Association["X1" -> Association["ElementType" -> "Real64"],
      "X2" -> Association["ElementType" -> "Real64"],
      "Y" -> Association["ElementType" -> "Real64"]], "KeyColumns" -> None,
    "Backend" -> "WolframKernel"], "Options" -> {},
  "BackendData" -> Association["ColumnData" -> DataStructure["ColumnTable",
      {{TabularColumn[Association["Data" -> {{0.7943069684562891, 0.7080887598055678,
             0.6739770017474946, 0.5995060111777462, 0.6136177288156994, 0.5979121341211697,
             0.4897163348012439, 0.4959688399555753, 0.36175361103397985, 0.09422864851800195,
             0.3675710756343489, 0.7291272674850633, 0.6276739045491935, 0.6773008599376125,
             0.4802276863628534, 0.7710106793403941, 0.670030496491105, 0.07729983367278592,
             0.7133629193617443, 0.5190929012254231, 0.7479525718447673, 0.3207406582871113,
             0.5066235805316166, 0.9734509795279178, 0.023526109681830665, 0.5759660120388694,
             0.5231024775906685, 0.6902880992940914, 0.36658861678374666, 0.37241849877863986,
             0.02346080789028626, 0.6785297349981696, 0.44077838418609927, 0.8047451549938156,
             0.5206695069830114, 0.012775316043024176, 0.6033649280853377, 0.4257263150890953,
             0.3599802094605511, 0.10901650649728412, 0.42643451794859155, 0.041841048162296834,
             0.22606956282409496, 0.5037680533075941, 0.7899902038405706, 0.1335020648278502,
             0.4379486408540876, 0.5478680739470048, 0.33517109453193394, 0.017116296468779657},
            {}, None}, "ElementType" -> "Real64"]], TabularColumn[
         Association["Data" -> {{0.9230476634675155, 0.42499115321423186, 0.37288479969978505,
             0.3507374270720074, 0.6082545753835462, 0.19619284998440922, 0.5031917790600378,
             0.4217592070384373, 0.2451739596655036, 0.7389472123661163, 0.15935202008896132,
             0.5214688747353473, 0.7874057737586853, 0.2254462080599493, 0.32346966653261977,
             0.33813249238476617, 0.041703820652366996, 0.8923328112815783, 0.9681733989279382,
             0.9464717771022899, 0.44876546606335377, 0.627411992791097, 0.415550371754247,
             0.7200651139244627, 0.9141492863288361, 0.17745401194963595, 0.3922212199378168,
             0.44475314203091587, 0.33529090525314054, 0.04488252142354687, 0.35007984777532175,
             0.5254632152232677, 0.8817942543510673, 0.3158581306052035, 0.6754707812763221,
             0.6450549095198239, 0.1850501803278557, 0.931482766417933, 0.7630732904987889,
             0.65640354073023, 0.3643179137286363, 0.8848103747713731, 0.9809099392752705,
             0.9294715298165228, 0.713500694185788, 0.2613313038377727, 0.8393931045648171,
             0.45265672472382534, 0.7120355962750355, 0.3795492556801465}, {}, None},
          "ElementType" -> "Real64"]], TabularColumn[Association[
          "Data" -> {{4.0908983691342895, 3.4373474949444756, 3.0425458981237674,
             2.2859542022837855, 2.4949243099606684, 2.216400882128132, 3.244503153938381,
             2.500518688229991, 0.9437692263395425, 3.2678029099823633, 1.925631536427386,
             3.3131925691656097, 3.0841244512596164, 1.6828709274396894, 1.3297500620895106,
             1.302129557925297, 2.1738934976685975, 2.510679748702334, 4.227355852707408,
             3.821414396594548, 2.8227548815966474, 2.0522560237671743, 2.0799967958305903,
             4.886964195157835, 2.419942529984725, 1.6218707627693312, 2.395865558591849,
             1.9114879950286132, 2.0947312669319795, 0.4116252471645142, 1.470987060550402,
             4.075706373070064, 2.802722100037144, 2.348126978852138, 2.419869116420164,
             0.8540562158501932, 1.4925448113468731, 3.929805403547816, 2.660376622307889,
             2.2338003598785994, 2.0582875836688115, 2.1184320549090625, 4.163433606803859,
             3.5721792402863244, 3.215878081945034, 0.8195752117171486, 3.4471135378854214,
             1.6299510492769407, 2.643434277272899, 1.066462924939963}, {}, None},
          "ElementType" -> "Real64"]]}}]]]] -> "Y", PolynomialModel[1], "Report"];
Inspect the model name, hyperparameters, variables and input/output sizes:
report[{"Name", "Hyperparameters", "Variables", "InputSize", "OutputSize"}]report["Schema"]Inspect the inferred task and the column-to-variable mapping:
report[{"Task", "ColumnVariableMap"}]Parameters (1)
Fit a quadratic polynomial and create a report:
report = ModelFit[{...}, PolynomialModel[2], "Report"];Inspect the fitted parameter values:
report["ParameterValues"]Or as a name-value association:
report["ParameterAssociation"]report["ParameterRules"]Inspect the number of parameters:
report[{"ParameterCount", "EstimatedParameterCount"}]Fit Summary (1)
Fit a polynomial model on a noisy sinusoid:
SeedRandom[123];report = ModelFit[Table[{x, Sin[x] + RandomVariate[NormalDistribution[0, 0.2]]}, {x, 0, 2 Pi, 0.1}], PolynomialModel[5], "Report"];Inspect the training loss and the loss function used:
report[{"TrainingLoss", "CriterionFunction", "LossMetric"}]Inspect summary statistics of the fit:
report[{"MeanAbsoluteError", "RootMeanSquaredError", "CoefficientOfVariation"}]report["FitResiduals"]Diagnostic Plots (1)
Fit a linear model and create a report:
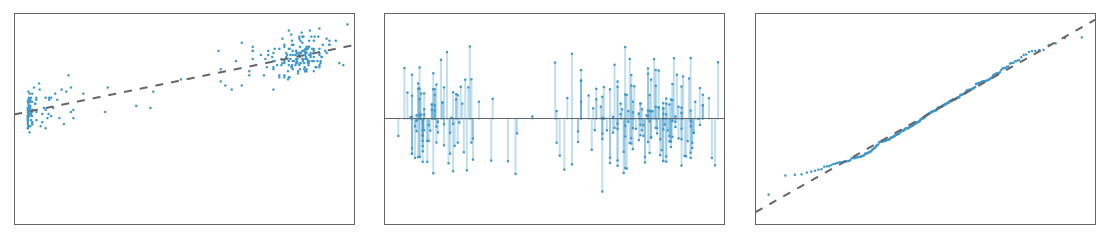
report = ModelFit[{...}, PolynomialModel[1], "Report"];Residual histogram with a fitted normal overlay:
report["ResidualHistogram"]Residuals against fitted values:
report["ResidualPlot"]Residuals against the predictor (1D inputs only):
report["ResidualTrendPlot"]Compare the residual distribution to a normal distribution:
report[{"ProbabilityPlot", "QuantilePlot"}]Predicted versus actual response:
report["ComparisonPlot"]Model Selection and Cross-Validation (2)
Compare three candidate models on the same data:
report = ModelFit[{...}, {PolynomialModel[3], PolynomialModel[5], FormulaModel[a Sin[x] + b Cos[x], x]}, "Report"];View the cross-validation chart of per-fold losses:
report["CrossValidationChart"]Inspect per-candidate cross-validation results:
report["CrossValidationData"]Inspect the validation set strategy used:
report["ValidationSet"]Tune a model hyperparameter automatically:
report = ModelFit[{...}, PolynomialModel["Degree" -> Automatic], "Report"];Inspect the searched and selected hyperparameters:
report[{"Hyperparameters", "HyperparameterDefaultDomain"}]View the cross-validation chart of candidate degrees:
report["CrossValidationChart"]Classical Inference (2)
Fit a parametric polynomial and create a report:
report = ModelFit[{...}, PolynomialModel[2], "Report"];View standard goodness-of-fit measures:
report[{"RSquared", "AdjustedRSquared", "AIC", "BIC", "LogLikelihood"}]View the analysis-of-variance table:
report["ANOVA"]View parameter estimates with standard errors, t-statistics, p-values and confidence intervals:
report["ParameterEstimates"]View the parameter correlation matrix:
report["CorrelationMatrix"]View confidence bands for the mean prediction and for individual observations:
report[{"MeanPredictionBands", "SinglePredictionBands"}]View the fitted function with its mean uncertainty:
report["BestFitAround"]Inference is also available for nonlinear "Formula" models:
report = ModelFit[{...}, FormulaModel[a Exp[b t], t], "Report"];Inspect parameter estimates of the nonlinear fit:
report["ParameterEstimates"]Linear-Only Properties (1)
Fit a cubic polynomial and create a report:
report = ModelFit[{...}, PolynomialModel[3], "Report"];View the basis used in the fit:
report[{"Basis", "BasisFunctions"}]report["DesignMatrix"] // ShortView Cook's distance influence measures:
report["CookDistances"]//ListPlotView the Durbin–Watson statistic for residual autocorrelation:
report["DurbinWatsonD"]View variance inflation factors for collinearity diagnostics:
report["VarianceInflationFactors"]View the eigenstructure of the design matrix:
report["Eigenstructure"]Options (1)
ValidationSet (1)
By default, multiple-candidate fits use cross-validation to select the best:
ModelFit[{...}, {PolynomialModel[3], PolynomialModel[8]}, "Report"]["BestModel"]Use ValidationSetNone to disable cross-validation; selection then uses training loss, which favors more complex models:
ModelFit[data, {PolynomialModel[3], PolynomialModel[8]}, "Report", ValidationSet -> None]["BestModel"]Applications (1)
Polynomial Calibration (1)
Compare candidate calibration polynomials by cross-validation:
calibrationReport = ModelFit[Tabular[Association["RawSchema" -> Association["ColumnProperties" ->
     Association["Voltage" -> Association["ElementType" -> "Real64"],
      "Reading" -> Association["ElementType" -> "Real64"]], "KeyColumns" -> None,
    "Backend" -> "WolframKernel"], "Options" -> {},
  "BackendData" -> Association["ColumnData" -> DataStructure["ColumnTable",
      {{TabularColumn[Association["Data" -> {{-0.010969476166896475, 0.2756153809445084,
             0.5207820922185693, 0.7382120799805829, 1.0546503217759733, 1.2194575138717634,
             1.3884391045677433, 1.6033829117905498, 1.9298236690440007, 2.1595798162468003,
             2.367355741269225, 2.6149295615382373, 2.8757709756995933, 3.150341716269671,
             3.360699947498413, 3.5569273796855154, 3.821188866160027, 4.044329289569808,
             4.341736469478583, 4.5009121623508825, 4.775050396904824, 4.920234619356804,
             5.267961383451918, 5.43335374821147, 5.720402240607762, 6.004672093624466,
             6.16321146501294, 6.421879659757259, 6.665247110897798, 6.902026686189424,
             7.139691140772724, 7.349878040928825, 7.624102766754143, 7.866146435686653,
             8.051876254983217, 8.307844845246612, 8.641181697728147, 8.701847646517464,
             9.120930327367718, 9.318861415929092, 9.52196552528913, 9.760115115694656,
             9.985932139714121}, {}, None}, "ElementType" -> "Real64"]],
        TabularColumn[Association["Data" -> {{0.38200464232946085, 1.22920283637981,
             1.8871214084808126, 2.431102383486541, 3.8370701938421057, 4.136745328689834,
             5.004704005622051, 5.943201058496604, 8.04503161230135, 9.208474450290996,
             10.463510706895864, 12.325074493062694, 14.253163457745133, 16.530890253895745,
             17.676161844800358, 19.786386858995463, 22.017825435262473, 24.336079367722263,
             27.493189513965678, 28.82373837759027, 31.711583786858043, 33.492037474480455,
             37.710262256890346, 39.682799310310166, 43.127856462197144, 46.91181543787276,
             49.48299977606753, 52.822705440684544, 56.5752519915548, 59.714249740311345,
             63.60854403514109, 67.07747132755826, 71.78988873463463, 75.71744353017456,
             78.71636123670012, 83.23334305668024, 89.2952640647672, 90.56832009523615,
             98.45483006078611, 102.29924398888342, 106.62476822948162, 111.1600309252503,
116.01116027231602}, {}, None}, "ElementType" -> "Real64"]]}}]]]] -> "Reading", PolynomialModel[1 | 2 | 3], "Report"]calibrationReport["CrossValidationChart"]Inspect parameter estimates with confidence intervals for the selected calibration:
calibrationReport["ParameterEstimates"]Check that the residuals are consistent with the noise model:
DistributionFitTest[calibrationReport["FitResiduals"], NormalDistribution[0, σ], "TestConclusion"]Text
Wolfram Research (2026), ModelFitReport, Wolfram Language function, https://reference.wolfram.com/language/ref/ModelFitReport.html.
CMS
Wolfram Language. 2026. "ModelFitReport." Wolfram Language & System Documentation Center. Wolfram Research. https://reference.wolfram.com/language/ref/ModelFitReport.html.
APA
Wolfram Language. (2026). ModelFitReport. Wolfram Language & System Documentation Center. Retrieved from https://reference.wolfram.com/language/ref/ModelFitReport.html