


Tabular
Details and Options
- Tabular is also known as data frame, table and structured data.
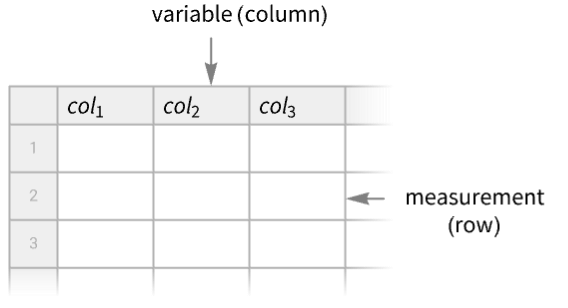
- Tabular is typically used for data where each column can be thought of as a variable and each row as a measurement. Typically, only a window of data is displayed.
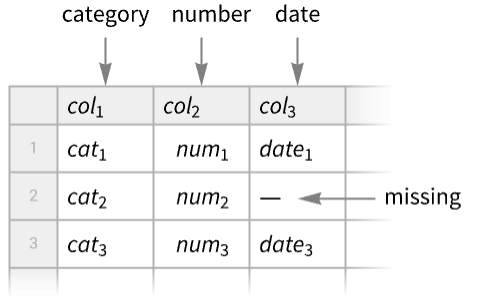
- Each column has an element type, such as number, string, date or expression. Data entries can be missing.
- Possible forms of data include:
-
{row1,row2,…} matrix as a list of rows » {assoc1,assoc2,…} list of associations with common keys » SparseArray[…],QuantityArray[…],… special matrix representations » Dataset[…] rectangular dataset » TimeSeries[…] collection of sampled time-value pairs EventSeries[…] series of temporal events - Use ToTabular to convert more types of expressions to Tabular as well as have detailed control over how the conversion is done.
- Tabular[data,schm] sets or modifies the schema of the tabular data, where schm is given as a TabularSchema object or an association <"prop1"val1,…>.
- SQL-backed tabular objects can be created using the following forms for spec in Tabular[spec]:
-
RelationalDatabase[…] relational database object containing a single table RelationalDatabase[…]"table" select a table from a relational database <"RelationalDatabase"RelationalDatabase[…],"Query""table"> extended specification of a table from a database - Tabular can recognize and operate with missing or exceptional values, such as Missing[], Null, Infinity, etc.
- The data elements can be extracted using Part, Select, etc.
- Tabular can be converted to other forms using FromTabular or Normal.
- Tabular works with transformation functions such as TransformColumns and AggregateRows.
- Tabular[tabular,options] applies the given options to a Tabular object.
- The following options control the overall appearance of Tabular:
-
AllowedDimensions Automatic restrictions on the number of rows or columns AppearanceElements Automatic elements to include in the displayed view BaselinePosition Automatic what to align with a surrounding text baseline BaseStyle {} base style specifications for the tabular ImageMargins Automatic margins around the displayed tabular ImageSize Automatic the overall size of the table view Scrollbars {Automatic,Automatic} whether to include scrollbars ScrollPosition Automatic scroll position if scrolling is enabled - Possible elements in AppearanceElements include "RowHeaders", "CollapsedRowHeaders", "ColumnHeaders", "CollapsedColumnHeaders", "Frame" and "ResizeArea".
- Tabular takes the following options that determine the appearance of the tabular content:
-
Alignment Automatic horizontal and vertical alignment of items Background None what background colors to use Dividers Automatic whether to include dividers between cells HeaderAlignment Automatic horizontal and vertical alignments of headers HeaderBackground Automatic background colors to use for headers HeaderSize Automatic width and height of headers HeaderStyle Automatic styles to use for headers ItemDisplayFunction None function to use to format items ItemSize Automatic width and height of each item ItemStyle {} styles for columns and rows - The content options take the form opt<"elem"spec,…>, where "elem" specifies which elements the spec is affecting.
- Possible elements are:
-
"Columns"{s1,s2,…} style columns by position "Rows"{s1,s2,…} style rows by position "ColumnRules"{col1s1,…} style columns by keys "RowRules"{row1s1,…} style rows by index "ItemRules"{{row1,col1}s1,…} style items by row and column "ColumnValueFunction"cf style columns by values "RowValueFunction"rf style rows by values "ItemValueFunction"if style items by value - "Columns" and "Rows" take the following forms:
-
{s1,s2,…,sn} use s1 through sn, then use defaults s use s in all cases Cyclic[{c1,c2,…}] cycle through all ci {s1,s2,…,Cyclic[{c1,c2,…}],sm,…,sn} use the first sequence of si at the beginning, then cyclically use the ci, then use the last sequence of si at the end {s1,s2,…,Cyclic[{}],sm,…,sn} use the first sequence of si at the beginning and the last sequence at the end - The columns coli can be a column key "key" or the numerical index i of the column.
- The row rowi can be the numerical index i of the row, or RowKey[{…}] if Tabular contains key columns.
- "RowValueFunction"f applies the function f to each row of data, and it should either return a setting to use for the entire row or a list of keyval results indicating what settings to use per column.
- "ItemValueFunction" takes the following forms:
-
itfn use itfn to generate the setting for every item {col1itfn1,…}} use itfni to generate the setting for items in column coli - The arguments supplied to item value functions are the value val of the item, the position {row,col} in the tabular and the entire tabular object tab.
- "RowValueFunction" takes the following forms:
-
rwfn use rwfn to generate the setting for every item {col1rwfni,…}} use rwfn to generate the setting for items in column coli - The arguments supplied to row value functions are the association of row elements assoc, the row position row in the tabular and the entire tabular object tab.
Examples
open all close allBasic Examples (5)
Create a Tabular object from a matrix:
Tabular[{{1, 2, 3}, {4, 5, 6}}]Create a Tabular object from a matrix, specifying the column keys:
Tabular[{{1, x, Today}, {4, y, Tomorrow}}, {"col1", "col2", "col3"}]Create a Tabular object from a list of associations with common keys:
Tabular[{<|"a" -> 1, "b" -> 2, "c" -> 3|>, <|"a" -> 4, "b" -> 5, "c" -> 6|>}]Create a Tabular object from a list of columns:
ToTabular[{"a" -> {1, 4}, "b" -> {2, 5}, "c" -> {3, 6}}, "Columns"]Create a Tabular object from a Dataset:
Tabular[Dataset[{Association["a" -> 1, "b" -> 2, "c" -> 3], Association["a" -> 4, "b" -> 5, "c" -> 6]}]]Scope (27)
Creating Tabular Objects (11)
Construct a Tabular object from a list of rows:
Tabular[{{"M", 8.1, 16.1}, {"M", 13.9, 29.2}, {"M", 16.1, 33.8}, {"F", 7.2, 14.7}, {"F", 14.9, 30.1}}]Construct a Tabular object from a matrix, specifying column names:
Tabular[{{1, 2}, {3, 4}, {5, 6}}, {"col1", "col2"}]Construct a Tabular object from a list of associations:
Tabular[{<|"name" -> "John", "age" -> 25|>, <|"name" -> "Anne", "age" -> 20|>, <|"name" -> "Rob", "age" -> Missing[]|>}]Create a Tabular object from a list of associations with ExtendedKey:
Tabular[{<|ExtendedKey["AA", "a"] -> 1, ExtendedKey["AA", "b"] -> 2|>, <|ExtendedKey["AA", "a"] -> 3, ExtendedKey["AA", "b"] -> 4|>}]Create a Tabular object from a QuantityArray:
qa = QuantityArray[RandomReal[1, {6, 3}], {"Meters", "Seconds", "Grams"}]Tabular[qa]Tabular object from column-oriented list data requires Transpose:
dates = RandomDate[5, DateGranularity -> "Day"]values = {1.2, 7.3, 3.8, 4.2, 4.5};Tabular[Transpose[{dates, values}], {"date", "value"}]Use ToTabular instead:
ToTabular[{"date" -> dates, "value" -> values}, "Columns"]Convert a Dataset into a Tabular object:
data = Take[ExampleData[{"Dataset", "Planets"}], 4]Converting to Tabular will flatten the dataset structure:
Tabular[data]Use Import of "CSV" to automatically get a Tabular object:
Import["ExampleData/TreesOwnedByTheCityOfChampaign.csv", "Tabular"]Import a "TSV" file:
Import["ExampleData/RetailSales.tsv", "Tabular"]Construct a Tabular object of numbers, specifying the type of the elements of each column:
Tabular[{{1, 2}, {3, 4}, {5, 6}}, <|"ElementType" -> {"Integer64", "Integer16"}|>]ColumnTypes[%]Mix columns of different types:
Tabular[{{1, "dog", True}, {2, "cow", False}}, <|"ElementType" -> {"Integer8", "String", "Boolean"}|>]ColumnTypes[%]Show a Tabular object whose rows correspond to entities and whose columns are entity properties:
EntityValue["Country", {"Area", "HighestElevation", "Population", "PopulationDensity"}, "Tabular"]Extracting Data (9)
tab = Tabular[{{1, 2}, {3, 4}}]tab[[1, 2]]Extract a single element Tabular object:
tab[[{1}, {2}]]Normal[%]Tabular[{{1, 2}, {3, 4}}]%[[1]]Normal[%]Tabular[{{1, 2}, {3, 4}}]%[[All, 1]]Normal[%]Extract a column using a column key:
tab = Tabular[{<|"a" -> 1, "b" -> 0|>, <|"a" -> 1, "b" -> 1|>, <|"a" -> 2, "b" -> 0|>, <|"a" -> 2, "b" -> 1|>}]tab[[All, "b"]]Normal[%]Extract a row of a Tabular object with a key column:
tab = Tabular[{{"one", True, "foo"}, {"two", False, "bar"}}, <|"ColumnKeys" -> {"key", "col1", "col2"}, "KeyColumns" -> {"key"}|>]tab[Key["one"]]tab[RowKey["one"]]tab[<|"key" -> "one"|>]Extract a row of a Tabular object with several key columns:
tab = Tabular[{{"one", True, "foo"}, {"two", False, "bar"}}, <|"ColumnKeys" -> {"key1", "key2", "col"}, "KeyColumns" -> {"key1", "key2"}|>]tab[Key[{"one", True}]]tab[RowKey[{"one", True}]]tab[<|"key1" -> "one", "key2" -> True|>]Extract multiple columns from a Tabular object:
tab = ResourceData["Sample Tabular Data: Fisher Iris"]Extract two columns and reverse their order:
tab[[All, {3, 2}]]Extract multiple columns by column keys:
tab[[All, {"Species", "PetalLength", "SepalLength"}]]Use conditions to select rows:
tab = ResourceData["Sample Tabular Data: Fisher Iris"]Extract all the rows with "SepalLength" greater than or equal to 7 centimeters:
Select[tab, #SepalLength >= Quantity[7, "Centimeters"]&]Use column type to select columns:
tab = Tabular[{{"M", 8.1, 16.1}, {"M", 13.9, 29.2}, {"M", 16.1, 33.8}, {"F", 7.2, 14.7}, {"F", 14.9, 30.1}}, {"MF", "val1", "val2"}]Select columns of numeric type:
ColumnKeys[tab, #ElementType === "Real64"&]tab[All, %]Cleaning Data (4)
Take a Tabular object of country data:
tab = EntityValue[EntityClass["Country", "Europe"], {"Population", "Area"}, "Tabular"]Sort by decreasing values of population:
ReverseSortBy[tab, "Population"]Find the country with the smallest area:
MinimalBy[tab, "Area"]Tabular[{{1, 2}, {3, 4}, {5, 6}}, {"col1", "col2"}]DeleteColumns[%, "col2"]Tabular[{{1, 2}, {3, 4}, {5, 6}}, {"col1", "col2"}]InsertColumns[%, "col3" -> {"a", "b", "c"}]Tabular[{{1, 2}, {3, 4}, {5, 6}}, {"col1", "col2"}]RenameColumns[%, "col2" -> "c2"]Transforming Data (3)
times = DateRange[Today, Today + Quantity[4, "Days"]];
values = {1.2, 7.3, 3.8, 4.2, 4.5};
Tabular[Transpose[{times, values}], {"date", "value"}]
Keep the last column with the new one:
ConstructColumns[%, {"day" -> Function[DayName[#date]], "value"}]dates = {"Sep 1, 2024", "Sep 2, 2024", "Sep 3, 2024"};
values = {1.2, 7.3, 3.8};
Tabular[Transpose[{dates, values}], {"date", "value"}]TransformColumns[%, "date" -> Function[FromDateString[#date]]]Population and area of European countries:
tab = EntityValue[EntityClass["Country", "Europe"], {"Population", "Area"}, "Tabular"]TransformColumns[tab, "Density" -> Function[#Population / #Area]]Options (46)
Alignment (10)
Specify alignments for every column:
Tabular[{{1, 2, 3}, {4, 5, 6}}, {"a", "b", "c"}, Alignment -> <|"Columns" -> {Left, Center, Right}|>]If there are more columns than alignments, the later columns use default alignment:
Tabular[{{1, 2, 3, 4, 5}, {6, 7, 8, 9, 10}, {11, 12, 13, 14, 15}}, {"a", "b", "c", "d", "e"}, Alignment -> <|"Columns" -> {Center, Left}|>]Cycle between left and right column alignments:
Tabular[{{1, 2, 3, 4, 5}, {6, 7, 8, 9, 10}, {11, 12, 13, 14, 15}}, {"a", "b", "c", "d", "e"}, Alignment -> <|"Columns" -> Cyclic[{Left, Right}]|>]Start and end with center-aligned columns and cycle between left and right in between:
Tabular[{{1, 2, 3, 4, 5}, {6, 7, 8, 9, 10}, {11, 12, 13, 14, 15}}, {"a", "b", "c", "d", "e"}, Alignment -> <|"Columns" -> {Center, Cyclic[{Left, Right}], Center}|>]Start and end with left-aligned columns and use the default alignment in between:
Tabular[{{1, 2, 3, 4, 5}, {6, 7, 8, 9, 10}, {11, 12, 13, 14, 15}}, {"a", "b", "c", "d", "e"}, Alignment -> <|"Columns" -> {Left, Cyclic[{}], Left}|>]Tabular[{{1, 2, 3, 4, 5}, {6, 7, 8, 9, 10}, {11, 12, 13, 14, 15}}, {"a", "b", "c", "d", "e"}, Alignment -> <|"ColumnRules" -> {"b" -> Left}|>]Specify the alignment of an item using its {row,col} position:
Tabular[{{1, 2, 3, 4, 5}, {6, 7, 8, 9, 10}, {11, 12, 13, 14, 15}}, {"a", "b", "c", "d", "e"}, Alignment -> <|"ItemRules" -> {{3, "b"} -> Left}|>]Left-align rows if the value in column "b" is more than 10 and right-align otherwise:
Tabular[{{1, 2, 3, 4, 5}, {6, 7, 8, 9, 10}, {11, 12, 13, 14, 15}}, {"a", "b", "c", "d", "e"}, Alignment -> <|"RowValueFunction" -> (If[#b > 10, Left, Right]&)|>]Use None to use the default alignment:
Tabular[{{1, 2, 3, 4, 5}, {6, 7, 8, 9, 10}, {11, 12, 13, 14, 15}}, {"a", "b", "c", "d", "e"}, Alignment -> <|"RowValueFunction" -> (If[#b > 10, Left, None]&)|>]Left-align items if the value is even and center-align them otherwise:
Tabular[{{1, 2, 3, 4, 5}, {6, 7, 8, 9, 10}, {11, 12, 13, 14, 15}}, {"a", "b", "c", "d", "e"}, Alignment -> <|"ItemValueFunction" -> (If[EvenQ[#], Left, Center]&)|>]Use None to use the default alignment:
Tabular[{{1, 2, 3, 4, 5}, {6, 7, 8, 9, 10}, {11, 12, 13, 14, 15}}, {"a", "b", "c", "d", "e"}, Alignment -> <|"ItemValueFunction" -> (If[EvenQ[#], Left, None]&)|>]Align the "b" column based on its value:
Tabular[{{1, 2, 3, 4, 5}, {6, 7, 8, 9, 10}, {11, 12, 13, 14, 15}}, {"a", "b", "c", "d", "e"}, Alignment -> <|"ItemValueFunction" -> {"b" -> (If[# > 10, Left, Right]&)}|>]Background (13)
Use a single style as the background for all the items:
Tabular[{{1, 2, 3}, {4, 5, 6}}, {"a", "b", "c"}, Background -> RGBColor[0.95, 0.627, 0.1425]]Specify backgrounds for every column:
Tabular[{{1, 2, 3}, {4, 5, 6}}, {"a", "b", "c"}, Background -> <|"Columns" -> {RGBColor[0.24, 0.6, 0.8], RGBColor[0.95, 0.627, 0.1425], RGBColor[0.455, 0.7, 0.21]}|>]Specify backgrounds for every row:
Tabular[{{1, 2, 3}, {4, 5, 6}}, {"a", "b", "c"}, Background -> <|"Rows" -> {RGBColor[0.24, 0.6, 0.8], RGBColor[0.95, 0.627, 0.1425]}|>]If there are more columns than styles, the later columns use default styling:
Tabular[{{1, 2, 3, 4, 5}, {6, 7, 8, 9, 10}, {11, 12, 13, 14, 15}}, {"a", "b", "c", "d", "e"}, Background -> <|"Columns" -> {RGBColor[0.24, 0.6, 0.8], RGBColor[0.95, 0.627, 0.1425], RGBColor[0.455, 0.7, 0.21]}|>]If there are more rows than styles, the later rows use default styling:
Tabular[{{1, 2, 3, 4, 5}, {6, 7, 8, 9, 10}, {11, 12, 13, 14, 15}}, {"a", "b", "c", "d", "e"}, Background -> <|"Rows" -> {RGBColor[0.24, 0.6, 0.8], RGBColor[0.95, 0.627, 0.1425]}|>]Cycle between blue and green column backgrounds:
Tabular[{{1, 2, 3, 4, 5}, {6, 7, 8, 9, 10}, {11, 12, 13, 14, 15}}, {"a", "b", "c", "d", "e"}, Background -> <|"Columns" -> Cyclic[{RGBColor[0.24, 0.6, 0.8], RGBColor[0.455, 0.7, 0.21]}]|>]Cycle between blue and green row backgrounds:
Tabular[{{1, 2, 3, 4, 5}, {6, 7, 8, 9, 10}, {11, 12, 13, 14, 15}, {1, 3, 5, 7, 9}, {2, 4, 6, 8, 10}}, {"a", "b", "c", "d", "e"}, Background -> <|"Rows" -> Cyclic[{RGBColor[0.24, 0.6, 0.8], RGBColor[0.455, 0.7, 0.21]}]|>]Start and end with blue and red column backgrounds, and cycle between orange and green in between:
Tabular[{{1, 2, 3, 4, 5}, {6, 7, 8, 9, 10}, {11, 12, 13, 14, 15}}, {"a", "b", "c", "d", "e"}, Background -> <|"Columns" -> {RGBColor[0.24, 0.6, 0.8], Cyclic[{RGBColor[0.95, 0.627, 0.1425], RGBColor[0.455, 0.7, 0.21]}], RGBColor[0.922526, 0.385626, 0.209179]}|>]Start and end with blue and red row backgrounds, and cycle between orange and green in between:
Tabular[{{1, 2, 3, 4, 5}, {6, 7, 8, 9, 10}, {11, 12, 13, 14, 15}, {1, 3, 5, 7, 9}, {2, 4, 6, 8, 10}}, {"a", "b", "c", "d", "e"}, Background -> <|"Rows" -> {RGBColor[0.24, 0.6, 0.8], Cyclic[{RGBColor[0.95, 0.627, 0.1425], RGBColor[0.455, 0.7, 0.21]}], RGBColor[0.922526, 0.385626, 0.209179]}|>]Start and end with blue and red column backgrounds, and use the default styling in between:
Tabular[{{1, 2, 3, 4, 5}, {6, 7, 8, 9, 10}, {11, 12, 13, 14, 15}}, {"a", "b", "c", "d", "e"}, Background -> <|"Columns" -> {RGBColor[0.24, 0.6, 0.8], Cyclic[{}], RGBColor[0.922526, 0.385626, 0.209179]}|>]Start and end with blue and red row backgrounds, and use the default styling in between:
Tabular[{{1, 2, 3, 4, 5}, {6, 7, 8, 9, 10}, {11, 12, 13, 14, 15}, {1, 3, 5, 7, 9}, {2, 4, 6, 8, 10}}, {"a", "b", "c", "d", "e"}, Background -> <|"Rows" -> {RGBColor[0.24, 0.6, 0.8], Cyclic[{}], RGBColor[0.922526, 0.385626, 0.209179]}|>]Use a blue background for the column "b":
Tabular[{{1, 2, 3, 4, 5}, {6, 7, 8, 9, 10}, {11, 12, 13, 14, 15}}, {"a", "b", "c", "d", "e"}, Background -> <|"ColumnRules" -> {"b" -> RGBColor[0.24, 0.6, 0.8]}|>]Use a blue background for the second row:
Tabular[{{1, 2, 3, 4, 5}, {6, 7, 8, 9, 10}, {11, 12, 13, 14, 15}}, {"a", "b", "c", "d", "e"}, Background -> <|"RowRules" -> {2 -> RGBColor[0.24, 0.6, 0.8]}|>]Use RowKey[{…}] to style a row:
Tabular[{{"apple", 2, 3, 4, 5}, {"banana", 7, 8, 9, 10}, {"grape", 12, 13, 14, 15}}, <|...|>, Background -> <|"RowRules" -> {RowKey[{"banana"}] -> RGBColor[0.24, 0.6, 0.8]}|>]Specify the background style of an item using its {row,col} position:
Tabular[{{1, 2, 3, 4, 5}, {6, 7, 8, 9, 10}, {11, 12, 13, 14, 15}}, {"a", "b", "c", "d", "e"}, Background -> <|"ItemRules" -> {{3, "b"} -> RGBColor[0.24, 0.6, 0.8]}|>]Color row backgrounds red if the value in column "b" is more than 10, and blue otherwise:
Tabular[{{1, 2, 3, 4, 5}, {6, 7, 8, 9, 10}, {11, 12, 13, 14, 15}}, {"a", "b", "c", "d", "e"}, Background -> <|"RowValueFunction" -> (If[#b > 10, RGBColor[0.91, 0.318, 0.243], RGBColor[0.24, 0.6, 0.8]]&)|>]Use None to use the default background style:
Tabular[{{1, 2, 3, 4, 5}, {6, 7, 8, 9, 10}, {11, 12, 13, 14, 15}}, {"a", "b", "c", "d", "e"}, Background -> <|"RowValueFunction" -> (If[#b > 10, RGBColor[0.91, 0.318, 0.243], None]&)|>]Color the second row based on the "b" column's value:
Tabular[{{1, 2, 3, 4, 5}, {6, 7, 8, 9, 10}, {11, 12, 13, 14, 15}}, {"a", "b", "c", "d", "e"}, Background -> <|"RowValueFunction" -> {2 -> (If[#b > 10, RGBColor[0.91, 0.318, 0.243], RGBColor[0.24, 0.6, 0.8]]&)}|>]Color item backgrounds red if the value is even, and blue otherwise:
Tabular[{{1, 2, 3, 4, 5}, {6, 7, 8, 9, 10}, {11, 12, 13, 14, 15}}, {"a", "b", "c", "d", "e"}, Background -> <|"ItemValueFunction" -> (If[EvenQ[#], RGBColor[0.91, 0.318, 0.243], RGBColor[0.24, 0.6, 0.8]]&)|>]Use None to use the default background style:
Tabular[{{1, 2, 3, 4, 5}, {6, 7, 8, 9, 10}, {11, 12, 13, 14, 15}}, {"a", "b", "c", "d", "e"}, Background -> <|"ItemValueFunction" -> (If[EvenQ[#], RGBColor[0.91, 0.318, 0.243], None]&)|>]Color the "b" column based on its value:
Tabular[{{1, 2, 3, 4, 5}, {6, 7, 8, 9, 10}, {11, 12, 13, 14, 15}}, {"a", "b", "c", "d", "e"}, Background -> <|"ItemValueFunction" -> {"b" -> (If[# > 10, RGBColor[0.91, 0.318, 0.243], RGBColor[0.24, 0.6, 0.8]]&)}|>]BaselinePosition (1)
Align the center of the tabular with the baseline of surrounding text:
{x, y, Tabular[{{1, 2, 3, 4, 5}, {6, 7, 8, 9, 10}, {11, 12, 13, 14, 15}}, BaselinePosition -> Center], z}Align the bottom of the tabular with the baseline:
{x, y, Tabular[{{1, 2, 3, 4, 5}, {6, 7, 8, 9, 10}, {11, 12, 13, 14, 15}}, BaselinePosition -> Bottom], z}ImageSize (5)
By default, the width is limited by the notebook size, and a limited number of rows are shown:
ResourceData["Sample Tabular Data: Car Models"]Use a named size to show less of the Tabular object:
Tabular[ResourceData["Sample Tabular Data: Car Models"], ImageSize -> Small]Limit the width of a Tabular object:
Tabular[ResourceData["Sample Tabular Data: Car Models"], ImageSize -> 300]Limit the width and height of a Tabular object:
Tabular[ResourceData["Sample Tabular Data: Car Models"], ImageSize -> {300, 100}]Limit the overall height of a Tabular object:
Tabular[ResourceData["Sample Tabular Data: Car Models"], ImageSize -> {Automatic, 100}]ItemDisplayFunction (1)
Use ItemDisplayFunction to change how missing values should be displayed:
Tabular[{{9, Missing[], 2, 3, 3}, {6, 3, 1, 3, 10}, {1, 7, 4, Missing[], Missing[]}, {5, 7, 6, 4, 3}, {9, 5, 4, 9, 6}}, ItemDisplayFunction -> (If[MissingQ[#], Style["●", StandardRed], #]&)]ItemSize (1)
Increase the height of items with ItemSize:
Tabular[ResourceData["Sample Tabular Data: Car Models"], ItemSize -> 3]Specify the width and height of items:
Tabular[ResourceData["Sample Tabular Data: Car Models"], ItemSize -> {10, 3}]Use Cyclic to assign a repeating item size from the second column to the last:
Tabular[ResourceData["Sample Tabular Data: Car Models"], ItemSize -> {{15, Cyclic[{5}]}, Automatic}]ItemStyle (13)
Use a single style as the style for all the items:
Tabular[{{1, 2, 3}, {4, 5, 6}}, {"a", "b", "c"}, ItemStyle -> Bold]Use Directive to combine styles into a single style:
Tabular[{{1, 2, 3}, {4, 5, 6}}, {"a", "b", "c"}, ItemStyle -> Directive[Bold, Italic]]Specify styles for every column:
Tabular[{{1, 2, 3}, {4, 5, 6}}, {"a", "b", "c"}, ItemStyle -> <|"Columns" -> {Bold, Italic, Red}|>]Tabular[{{1, 2, 3}, {4, 5, 6}}, {"a", "b", "c"}, ItemStyle -> <|"Rows" -> {Bold, Red}|>]If there are more columns than styles, the later columns use default styling:
Tabular[{{1, 2, 3, 4, 5}, {6, 7, 8, 9, 10}, {11, 12, 13, 14, 15}}, {"a", "b", "c", "d", "e"}, ItemStyle -> <|"Columns" -> {RGBColor[0.24, 0.6, 0.8], RGBColor[0.95, 0.627, 0.1425], RGBColor[0.455, 0.7, 0.21]}|>]If there are more rows than styles, the later rows use default styling:
Tabular[{{1, 2, 3, 4, 5}, {6, 7, 8, 9, 10}, {11, 12, 13, 14, 15}}, {"a", "b", "c", "d", "e"}, ItemStyle -> <|"Rows" -> {RGBColor[0.24, 0.6, 0.8], RGBColor[0.95, 0.627, 0.1425]}|>]Cycle between blue and green column styles:
Tabular[{{1, 2, 3, 4, 5}, {6, 7, 8, 9, 10}, {11, 12, 13, 14, 15}}, {"a", "b", "c", "d", "e"}, ItemStyle -> <|"Columns" -> Cyclic[{RGBColor[0.24, 0.6, 0.8], RGBColor[0.455, 0.7, 0.21]}]|>]Cycle between blue and green row styles:
Tabular[{{1, 2, 3, 4, 5}, {6, 7, 8, 9, 10}, {11, 12, 13, 14, 15}, {1, 3, 5, 7, 9}, {2, 4, 6, 8, 10}}, {"a", "b", "c", "d", "e"}, ItemStyle -> <|"Rows" -> Cyclic[{RGBColor[0.24, 0.6, 0.8], RGBColor[0.455, 0.7, 0.21]}]|>]Start and end with blue and red column styles, and cycle between orange and green in between:
Tabular[{{1, 2, 3, 4, 5}, {6, 7, 8, 9, 10}, {11, 12, 13, 14, 15}}, {"a", "b", "c", "d", "e"}, ItemStyle -> <|"Columns" -> {RGBColor[0.24, 0.6, 0.8], Cyclic[{RGBColor[0.95, 0.627, 0.1425], RGBColor[0.455, 0.7, 0.21]}], RGBColor[0.922526, 0.385626, 0.209179]}|>]Start and end with blue and red row styles, and cycle between orange and green in between:
Tabular[{{1, 2, 3, 4, 5}, {6, 7, 8, 9, 10}, {11, 12, 13, 14, 15}, {1, 3, 5, 7, 9}, {2, 4, 6, 8, 10}}, {"a", "b", "c", "d", "e"}, ItemStyle -> <|"Rows" -> {RGBColor[0.24, 0.6, 0.8], Cyclic[{RGBColor[0.95, 0.627, 0.1425], RGBColor[0.455, 0.7, 0.21]}], RGBColor[0.922526, 0.385626, 0.209179]}|>]Start and end with blue and red column styles, and use the default styling in between:
Tabular[{{1, 2, 3, 4, 5}, {6, 7, 8, 9, 10}, {11, 12, 13, 14, 15}}, {"a", "b", "c", "d", "e"}, ItemStyle -> <|"Columns" -> {RGBColor[0.24, 0.6, 0.8], Cyclic[{}], RGBColor[0.922526, 0.385626, 0.209179]}|>]Start and end with blue and red row styles, and use the default styling in between:
Tabular[{{1, 2, 3, 4, 5}, {6, 7, 8, 9, 10}, {11, 12, 13, 14, 15}, {1, 3, 5, 7, 9}, {2, 4, 6, 8, 10}}, {"a", "b", "c", "d", "e"}, ItemStyle -> <|"Rows" -> {RGBColor[0.24, 0.6, 0.8], Cyclic[{}], RGBColor[0.922526, 0.385626, 0.209179]}|>]Use a blue style for the column "b":
Tabular[{{1, 2, 3, 4, 5}, {6, 7, 8, 9, 10}, {11, 12, 13, 14, 15}}, {"a", "b", "c", "d", "e"}, ItemStyle -> <|"ColumnRules" -> {"b" -> RGBColor[0.24, 0.6, 0.8]}|>]Use a blue style for the second row:
Tabular[{{1, 2, 3, 4, 5}, {6, 7, 8, 9, 10}, {11, 12, 13, 14, 15}}, {"a", "b", "c", "d", "e"}, ItemStyle -> <|"RowRules" -> {2 -> RGBColor[0.24, 0.6, 0.8]}|>]Use RowKey[{…}] to style a row:
Tabular[{{"apple", 2, 3, 4, 5}, {"banana", 7, 8, 9, 10}, {"grape", 12, 13, 14, 15}}, <|...|>, ItemStyle -> <|"RowRules" -> {RowKey[{"banana"}] -> RGBColor[0.24, 0.6, 0.8]}|>]Specify the styles style of an item using its {row,col} position:
Tabular[{{1, 2, 3, 4, 5}, {6, 7, 8, 9, 10}, {11, 12, 13, 14, 15}}, {"a", "b", "c", "d", "e"}, ItemStyle -> <|"ItemRules" -> {{3, "b"} -> RGBColor[0.24, 0.6, 0.8]}|>]Color row styles red if the value in column "b" is more than 10, and blue otherwise:
Tabular[{{1, 2, 3, 4, 5}, {6, 7, 8, 9, 10}, {11, 12, 13, 14, 15}}, {"a", "b", "c", "d", "e"}, ItemStyle -> <|"RowValueFunction" -> (If[#b > 10, RGBColor[0.91, 0.318, 0.243], RGBColor[0.24, 0.6, 0.8]]&)|>]Use None to use the default style:
Tabular[{{1, 2, 3, 4, 5}, {6, 7, 8, 9, 10}, {11, 12, 13, 14, 15}}, {"a", "b", "c", "d", "e"}, ItemStyle -> <|"RowValueFunction" -> (If[#b > 10, RGBColor[0.91, 0.318, 0.243], None]&)|>]Color the second column based on the "b" column's value:
Tabular[{{1, 2, 3, 4, 5}, {6, 7, 8, 9, 10}, {11, 12, 13, 14, 15}}, {"a", "b", "c", "d", "e"}, ItemStyle -> <|"RowValueFunction" -> {2 -> (If[#b > 10, RGBColor[0.91, 0.318, 0.243], RGBColor[0.24, 0.6, 0.8]]&)}|>]Color items red if the value is even, and blue otherwise:
Tabular[{{1, 2, 3, 4, 5}, {6, 7, 8, 9, 10}, {11, 12, 13, 14, 15}}, {"a", "b", "c", "d", "e"}, ItemStyle -> <|"ItemValueFunction" -> (If[EvenQ[#], RGBColor[0.91, 0.318, 0.243], RGBColor[0.24, 0.6, 0.8]]&)|>]Use None to use the default style:
Tabular[{{1, 2, 3, 4, 5}, {6, 7, 8, 9, 10}, {11, 12, 13, 14, 15}}, {"a", "b", "c", "d", "e"}, ItemStyle -> <|"ItemValueFunction" -> (If[EvenQ[#], RGBColor[0.91, 0.318, 0.243], None]&)|>]Color the "b" column based on its value:
Tabular[{{1, 2, 3, 4, 5}, {6, 7, 8, 9, 10}, {11, 12, 13, 14, 15}}, {"a", "b", "c", "d", "e"}, ItemStyle -> <|"ItemValueFunction" -> {"b" -> (If[# > 10, RGBColor[0.91, 0.318, 0.243], RGBColor[0.24, 0.6, 0.8]]&)}|>]Scrollbars (1)
ScrollPosition (1)
By default, the scrollbars are positioned to display the top-left corner of the content:
Tabular[RandomReal[1, {20, 15}], ScrollPosition -> Automatic]Specify a custom initial position of the scrollbars measured in points:
Tabular[RandomReal[1, {20, 15}], ScrollPosition -> {250, 0}]ScrollPosition can be Dynamic objects:
Row[{Column[{Slider[Dynamic[h], {0, 500, 1}], Tabular[RandomReal[1, {20, 15}], ScrollPosition -> Dynamic[{h, v}], Scrollbars -> False, ImageSize -> {400, 300}]}], VerticalSlider[Dynamic[v], {300, 0}]}]Applications (3)
Use a Tabular object to display column data with separate column headings:
name = {"Statistics", "FisherIris"};ExampleData[name, "LongDescription"]Use the array data and "ColumnHeadings" property to create a Tabular object:
tab = Tabular[ExampleData[name], ExampleData[name, "ColumnHeadings"]]Plot petal length as a function of sepal length:
ListPlot[tab -> {"SepalLength", "PetalLength"}]AggregateRows[tab, "corr" -> Function[Correlation[#SepalLength, #PetalLength]]]Compute mean values of flower measurements depending on the species type:
AggregateRows[tab, {"SepalLengthMean" -> Function[Mean[#SepalLength]], "SepalWidthMean" -> Function[Mean[#SepalWidth]], "PetalLengthMean" -> Function[Mean[#PetalLength]], "PetalWidthMean" -> Function[Mean[#PetalWidth]]}, "Species"]Information about "DuneBooks" in Tabular form:
EntityValue[EntityClass["Book", "DuneBooks"], {"FirstPublished", "Author", "Image"}, "Tabular"]Use ItemDisplayFunction to show a distribution glyph for a Tabular column and mark the current item’s value on the glyph.
First, generate the distribution plot with SmoothHistogram:
g = SmoothHistogram[ResourceData["Sample Tabular Data: Car Models"] -> "mpg", PlotStyle -> LightGray, Axes -> None, AspectRatio -> 1 / 3, PlotRangePadding -> Scaled[.05], PlotInteractivity -> False]Create a glyph function that adds a marker at the item value:
mpgGlyph[v_] := Labeled[Show[g, Epilog -> {RGBColor[0.91, 0.318, 0.243], Thick, InfiniteLine[{{v, 0}, {v, 1}}]}], v, Right]mpgGlyph[20]Apply to the tabular column "mpg" with ItemDisplayFunction:
Tabular[ResourceData["Sample Tabular Data: Car Models"],
	ItemDisplayFunction -> <|"mpg" -> (mpgGlyph[#]&)|>]
Properties & Relations (3)
Use TabularQ to test if a Tabular object is valid:
Tabular[{{1, 2}, {3, 4}}]TabularQ[%]The columns of a Tabular object are given as TabularColumn objects:
tab = Tabular[{{a, b}, {c, d}, {e, f}}]tab[All, 1]Normal[%]tab[All, 2]Normal[%]The rows of a Tabular object are given as TabularRow objects:
tab = Tabular[{{a, b, c}, {d, e, f}}]tab[1]Normal[%]tab[2]Normal[%]Possible Issues (3)
Tabular input data must be at least two dimensional:
Tabular[{x, y, z}]Tabular[{{x, y, z}}]Tabular[List /@ {x, y, z}]Raggedness in the second level is not accepted:
Tabular[{{a, b}, {c}}]Arrays must be rectangular in the first two levels:
Tabular[{{{a, b}, {c, d}}, {{A, B, X}, {C, D}}}]Tabular[PadRight[{{a, b}, {c}}, Automatic, Missing[]]]A Tabular object cannot have repeated column keys, which makes Part eliminate duplicates:
tab = Tabular[{{1, True, Today}, {2, False, Tomorrow}}, {"col", "bool", "date"}]tab[[All, {"col", "col"}]]Map the Part extraction to generate duplicate columns:
tab[[All, #]]& /@ {"col", "col"}Create a Tabular object without column keys or with different column keys:
{Tabular[%], Tabular[%, {"a", "b"}]}Text
Wolfram Research (2025), Tabular, Wolfram Language function, https://reference.wolfram.com/language/ref/Tabular.html (updated 2025).
CMS
Wolfram Language. 2025. "Tabular." Wolfram Language & System Documentation Center. Wolfram Research. Last Modified 2025. https://reference.wolfram.com/language/ref/Tabular.html.
APA
Wolfram Language. (2025). Tabular. Wolfram Language & System Documentation Center. Retrieved from https://reference.wolfram.com/language/ref/Tabular.html