

HistogramTransform
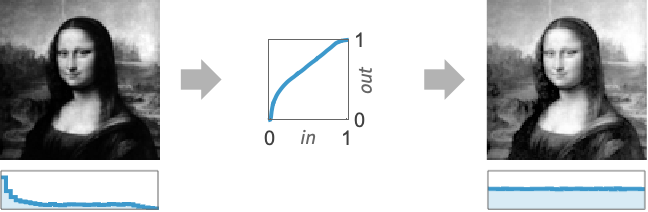
HistogramTransform[image]
transforms pixel values of image so that its histogram is nearly flat.
HistogramTransform[image,ref]
modifies pixel values of image so that its histogram would have nearly the same distribution as ref.
HistogramTransform[image,ref,n]
uses n equally spaced quantiles.
HistogramTransform[{x1,x2,…},…]
transforms values xi.
Details
- HistogramTransform is a point operation that changes the shape of the image histogram. Histogram transformation is typically used for equalization or matching with a reference distribution.
- HistogramTransform[image] returns an image with an approximately flat histogram, effectively known as histogram equalization.
- HistogramTransform[image,ref] finds an interpolating function between the quantiles of image and ref and applies it to each pixel in image, effectively known as histogram matching.
- HistogramTransform works with 3D as well as 2D images, and also with lists of arbitrary rank datasets.
- HistogramTransform[image,…] returns an image of the same type as the input image.
- With multichannel images, HistogramTransform[image] operates separately on each channel.
- HistogramTransform[{data1,data2,…},…] transforms multiple datasets datai.
- In HistogramTransform[image,ref], ref should be a univariate distribution, an image with either one channel or the same number of channels as image, a list of values, or a list of datasets with length equal to the number of channels in image.
- HistogramTransform[source] is equivalent to HistogramTransform[source,UniformDistribution[{0,1}]].
- HistogramTransform[source,ref,n] finds an interpolating function with n equally spaced quantiles.
- HistogramTransform[image,ref] is equivalent to HistogramTransform[image,ref,256].
- With HistogramTransform[data,ref,Automatic], the number of quantiles is the same as the number of bins used in Histogram[data].
Examples
open all close allBasic Examples (3)
Scope (6)
Data (5)
Transform a dataset so that it is distributed normally:
data = {91, 69, 16, 16, 11, 24, 23, 7, 83, 79, 17, 22, 50, 37, 36, 61, 22, 34, 39, 63, 59, 75, 10, 81, 71, 73, 77, 27, 58, 1, 23, 61, 19, 27, 86, 36, 3, 30, 68, 89, 29, 57, 13, 92, 7, 60, 80, 53, 14, 66};
Histogram[data]HistogramTransform[data, NormalDistribution[60, 10]]Histogram[%]Transform multiple datasets so that they are distributed uniformly:
datasets = Table[RandomVariate[dist, 1000], {dist, {NormalDistribution[], ChiSquareDistribution[4], ExponentialDistribution[1 / 2]}}];
Histogram[datasets, ChartLayout -> "Stacked"]flat = HistogramTransform[datasets];
Histogram[flat, ChartLayout -> "Stacked"]Make the pixel values follow a normal distribution:
i = [image];r = HistogramTransform[i, NormalDistribution[.5, .2]]ImageHistogram[#, 32, ImageSize -> 200]& /@ {i, r}Reshape the image histogram so that each channel follows a normal distribution:
HistogramTransform[[image], NormalDistribution[.5, .2]]Equalize the histogram of a 3D image:
HistogramTransform[\!\(\*Graphics3DBox[«8»]\)]Applications (6)
Basic Applications (3)
Equalize only the brightness of a color image:
{h, s, b} = ColorSeparate[[image], "HSB"];
ColorCombine[{h, s, HistogramTransform[b]}, "HSB"]
Equalize only the saturation of a color image:
{h, s, b} = ColorSeparate[[image], "HSB"];
ColorCombine[{h, HistogramTransform[s], b}, "HSB"]
Create an image effect by composing an image and its equalized version:
img = [image];
ImageCompose[img, {HistogramTransform[img], .5}]
Color Transformation (2)
Transfer colors between images:
img = [image];ref = [image];
HistogramTransform[img, ref]
Perform the transfer in the Lab color space instead:
HistogramTransform[ColorConvert[img, "LAB"], ColorConvert[ref, "LAB"]]Colorize a grayscale image by searching for neighborhoods with similar luminance in a color image:
img = [image];ref = [image];Convert images into a color space where luminance and color information are not correlated:
limg = First@ColorSeparate[img, "LAB"];
{lref, aref, bref} = ColorSeparate[ref, "LAB"];
Normalize the luminance images by reshaping the histogram:
l2 = HistogramTransform[limg, lref];
ImageHistogram /@ {l2, lref}
Compute luminance neighborhood statistics and construct a function that gives the color associated to the closest luminance neighborhood:
radius = 2;
{neighimg, neighref} = ColorCombine[{
	MeanFilter[#, radius],
	StandardDeviationFilter[#, radius]}]& /@ {l2, lref};
nfun = Nearest[Flatten[ImageData@neighref, 1] -> Transpose[Flatten@ImageData@#& /@ {aref, bref}]];
For each pixel of the grayscale image, create a new pixel by preserving the initial luminance and selecting the nearest color in the reference image:
col = Map[First@nfun[#, 1]&, ImageData@neighimg, {2}];
ColorConvert[Image[Join[{ImageData@limg}, Transpose[col, {2, 3, 1}]], Interleaving -> False, ColorSpace -> "LAB"], "RGB"]
Multidimensional Probability Density Function Transfer (1)
Reshape the histogram of a multidimensional dataset by iteratively reshaping random marginal histograms:
multidimensionalReshape[source_, ref_, ϵ_ : 10 ^ -10, maxiterations_ : 200] :=
	FixedPoint[
	With[{R = randomRotationMatrix[Length[source]]},
	Transpose[R].HistogramTransform[R.#, R.ref]]&,
source, maxiterations, SameTest -> (RootMeanSquare[Norm /@ Transpose[#1 - #2]] < ϵ&)];randomRotationMatrix[n_] := If[Det@# == 1, #, randomRotationMatrix[n]]&[Transpose@#.DiagonalMatrix[Sign@Diagonal@#2]&@@QRDecomposition@RandomReal[NormalDistribution[], {n, n}]];Reshape a bivariate dataset to match binormal samples:
dist1 = DirichletDistribution[{1, 3, 2}];
dist2 = MultinormalDistribution[{-1, 1}, {{1, 1}, {1, 4}}];SeedRandom[0];
transformed = Transpose@multidimensionalReshape[
Transpose[x = RandomVariate[dist1, 1000]], Transpose@RandomVariate[dist2, 1000]];Assess the result by visualizing the joint histograms before and after the transfer:
Histogram3D[#, Automatic, "PDF"]& /@ {x, transformed}Test whether the transformed data is distributed according to the reference distribution:
DistributionFitTest[transformed, dist2]Reshape the joint histogram of the hue and the saturation to a circle:
{h, s, b} = ColorSeparate[[image], "HSB"];
source = Flatten[ImageData[#]]& /@ {h, s};
With[{a = Range[0, 2π, 2π / 10000.]},
ref = 1 / 2 + 1 / 2 * {Cos[a], Sin[a]}];SeedRandom[0];
newhs = multidimensionalReshape[source, ref, 10 ^ -3];Visualize the joint histograms before and after the transfer:
Histogram3D[Transpose@#, Automatic, "PDF"]& /@ {source, newhs}Create the corresponding result image:
Image[Append[Partition[#, First@ImageDimensions@b]& /@ newhs, ImageData@b], Interleaving -> False, ColorSpace -> "HSB"]Reshape the 3D joint histogram of an RGB image:
img = [image];ref = [image];
{width, height} = ImageDimensions[img];SeedRandom[0];
new = multidimensionalReshape[Flatten /@ ImageData[img, Interleaving -> False], Flatten /@ ImageData[ref, Interleaving -> False], 10 ^ -3, 5];Image[Partition[#, width]& /@ new, Interleaving -> False]Properties & Relations (1)
HistogramTransformInterpolation can be used to get the transformation function used in HistogramTransform:
i = [image];
f = HistogramTransformInterpolation[i]ImageApply[f, i] == HistogramTransform[i]Text
Wolfram Research (2012), HistogramTransform, Wolfram Language function, https://reference.wolfram.com/language/ref/HistogramTransform.html (updated 2014).
CMS
Wolfram Language. 2012. "HistogramTransform." Wolfram Language & System Documentation Center. Wolfram Research. Last Modified 2014. https://reference.wolfram.com/language/ref/HistogramTransform.html.
APA
Wolfram Language. (2012). HistogramTransform. Wolfram Language & System Documentation Center. Retrieved from https://reference.wolfram.com/language/ref/HistogramTransform.html