"SpanningTree" (Machine Learning Method)
"SpanningTree" (Machine Learning Method)
- Method for FindClusters, ClusterClassify and ClusteringComponents.
- Partitions data into clusters of similar elements using the "SpanningTree" clustering algorithm.
Details & Suboptions
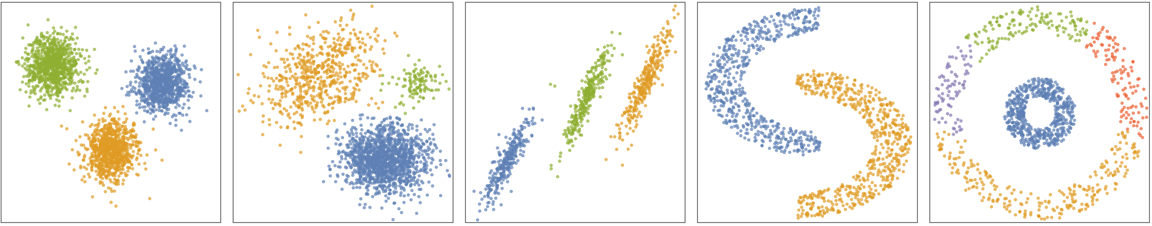
- "SpanningTree" is a neighbor-based clustering method. "SpanningTree" works for arbitrary cluster shapes and sizes; however, it can fail when clusters have different densities or are loosely connected.
- The following plots show the results of the "SpanningTree" method applied to toy datasets:
-
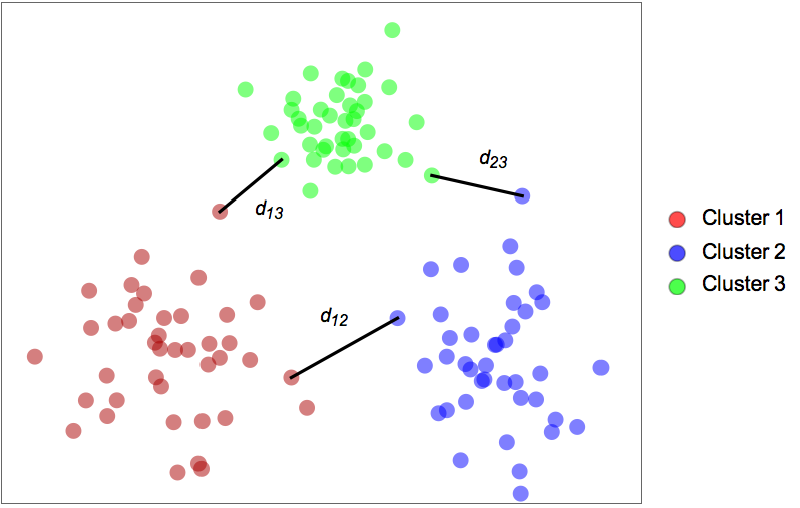
- The algorithm finds the set of clusters for which neighboring clusters are the most distant from each other. The distance dij between two neighboring clusters i and j is defined as the distance between their closest points:
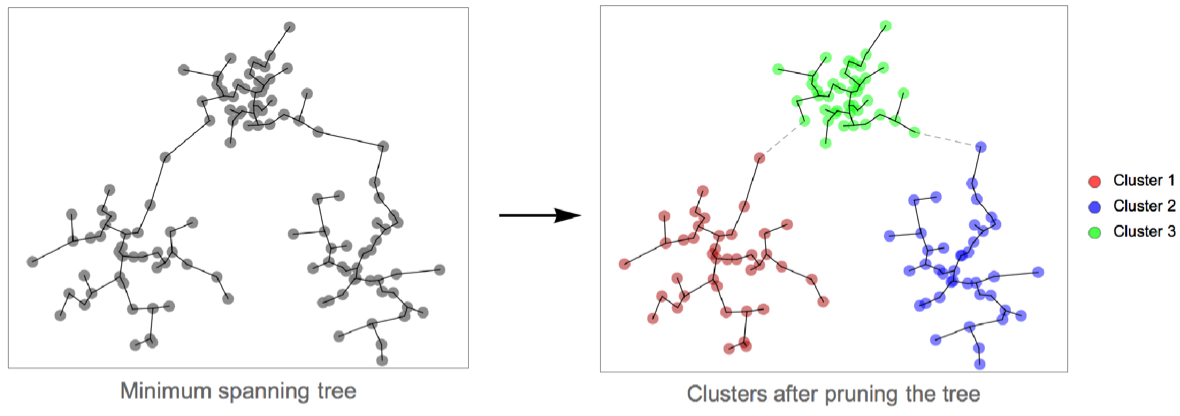
- Formally, the "SpanningTree" method constructs the minimum spanning tree of data points (using distances as graph weights). The longest edges of the tree are then pruned. Each connected component corresponds to a cluster. The pruning stops when the specified number of clusters is reached. When the number of clusters is not specified, the pruning stops when all edges are shorter than a given threshold.
- The option DistanceFunction can be used to define which distance to use.
- The following suboption can be given:
-
"MaxEdgeLength" Automatic pruning length threshold
Examples
open all close allBasic Examples (3)
Find clusters of nearby values using the "SpanningTree" method:
FindClusters[{1, 2, 10, 12, 6, 16, 25, 101, 150}, Method -> "SpanningTree"]data = TimeObject /@ RandomReal[AbsoluteTime[]//Round, 20]Train the ClassifierFunction using the "SpanningTree" method:
c = ClusterClassify[data, Method -> "SpanningTree"]Obtain the cluster assignment and cluster the data:
assignment = c[data]
GatherBy[data, c]SeedRandom[123]
data = Join[RandomReal[{-3, -0.1}, {100, 2}], RandomReal[{1, 3}, {100, 2}]];
ListPlot[data]Plot clusters identified by the "SpanningTree" method:
ListPlot[FindClusters[data, Method -> "SpanningTree"]]Scope (2)
Find cluster indices using ClusteringComponents:
ClusteringComponents[{10, 4, 5, 6, 11, 100, 150}, Method -> "SpanningTree"]Create and visualize noisy 2D moon-shaped training and test datasets:
circle[r_, theta_] := {r Sin[theta], r Cos[theta]};
{train, test} = With[{
	rot = RotationTransform[π, {0, 0}],
	tra = TranslationTransform[{1, 2.5}], pts = circle@@@RandomVariate[UniformDistribution[{{2, 3}, {0, Pi}}], 2000]},
	TakeDrop[RandomSample@Join[tra[rot[pts]], pts], 2000]
	];
ListPlot[{train, test}, PlotRange -> All, AspectRatio -> 1, PlotStyle -> Directive[ PointSize[0.013], Opacity[0.7]], Frame -> True, Axes -> False]
Train a ClassifierFunction using "SpanningTree" and find clusters in the test set:
cl = ClusterClassify[train, Method -> "SpanningTree"]
	decision = cl[test];
Visualizing two intertwined clusters found by "SpanningTree":
ncls = Length@Information[cl, "Classes"];
fcl = ListPlot[Pick[test, decision, #]& /@ Range[ncls], PlotStyle -> Directive[PointSize[0.025], Opacity[0.7]], AspectRatio -> 1, Frame -> True, Axes -> False]