

StadiumShape
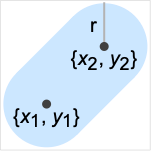
StadiumShape[{{x1,y1},{x2,y2}},r]
represents a stadium of radius r between the points {x1,y1} and {x2,y2}.
Details and Options
- StadiumShape can be used as a geometric region and graphics primitive.
- StadiumShape[] is equivalent to StadiumShape[{{-1,0},{1,0}},1].
- StadiumShape[r] is equivalent to StadiumShape[{{-1,0},{1,0}},r].
- StadiumShape[{p1,p2},r] represents the region {pRegionDistance[Line[p1,p2],p]≤r}.
- StadiumShape can be used in Graphics.
- In graphics, the points {xi,yi} can be Dynamic expressions.
- Graphics rendering is affected by directives such as FaceForm, EdgeForm, and color.
Examples
open all close allBasic Examples (5)
StadiumShape[]Graphics[%]Graphics[{Orange, StadiumShape[3]}]Graphics[{Orange, StadiumShape[{{0, 0}, {2, 3}}, 2]}]{Graphics[{Pink, StadiumShape[]}], Graphics[{EdgeForm[Thick], Pink, StadiumShape[]}], Graphics[{EdgeForm[Dashed], Pink, StadiumShape[]}], Graphics[{EdgeForm[Directive[Thick, Dashed, Blue]], Pink, StadiumShape[]}]}Get the Area of a stadium:
Area[StadiumShape[]]Area[StadiumShape[{{0, 0}, {x, y}}, 3]]Scope (16)
Graphics (6)
Specification (3)
Graphics[{Red, StadiumShape[3], Green, StadiumShape[2], Blue, StadiumShape[1]}]Graphics[{Red, StadiumShape[{{0, 0}, {2, 2}}, 1], Green, StadiumShape[{{-2, 2}, {0, 0}}, 1], Blue, StadiumShape[{{0, 0}, {0, -Sqrt[4]}}, 1]}]Short form for the standard stadium at the origin:
Graphics[StadiumShape[], Frame -> True]Styling (2)
Color directives specify the face colors of stadiums:
Table[Graphics[{c, StadiumShape[]}], {c, {Red, Green, Blue, Yellow}}]FaceForm and EdgeForm can be used to specify the styles of the interiors and boundaries:
Graphics[{FaceForm[Pink], EdgeForm[Directive[Dashed, Thick, Blue]], StadiumShape[]}]Graphics[{Yellow, EdgeForm[Directive[Thick, Blue]], StadiumShape[{{0, 0}, {3, 2}}, 1 / 2]}]Coordinates (1)
Points can be Dynamic:
DynamicModule[{x}, {Slider[Dynamic[x], {0, 2}], Graphics[{StadiumShape[{Dynamic[{x, x}], {-1, -1}}, 1]}, PlotRange -> 3]}]Regions (10)
RegionEmbeddingDimension[StadiumShape[{{Subscript[x, 1], Subscript[y, 1]}, {Subscript[x, 2], Subscript[y, 2]}}, r]]RegionDimension[StadiumShape[{{Subscript[x, 1], Subscript[y, 1]}, {Subscript[x, 2], Subscript[y, 2]}}, r]]{RegionMember[StadiumShape[], {0, 0}], RegionMember[StadiumShape[], {0, 2}]}Get conditions for point membership:
RegionMember[StadiumShape[{{Subscript[x, 1], Subscript[y, 1]}, {Subscript[x, 2], Subscript[y, 2]}}, r], {x, y}]ℛ = StadiumShape[];{Area[ℛ], RegionMeasure[ℛ]}c = RegionCentroid[ℛ]Graphics[{{Pink, ℛ}, {Black, Point[c]}}]ℛ = StadiumShape[];{RegionDistance[ℛ, {1, 2}], RegionDistance[ℛ, {0, 0}]}The distance to the nearest point in the standard stadium:
{Plot3D[RegionDistance[ℛ, {x, y}], {x, -2, 2}, {y, -2, 2}, MeshFunctions -> {#3&}, Mesh -> 5, Exclusions -> Norm[{x, y}] == 1], ContourPlot[RegionDistance[ℛ, {x, y}], {x, -3, 3}, {y, -3, 3}, Contours -> {{0.5, Red}, {1, Green}, {1.5, Blue}}]}ℛ = StadiumShape[];{SignedRegionDistance[ℛ, {1, 2}], SignedRegionDistance[ℛ, {0, 0}]}Signed distance to the standard stadium:
Plot3D[SignedRegionDistance[ℛ, {x, y}], {x, -2, 2}, {y, -2, 2}, MeshFunctions -> {#3&}, Mesh -> {{0}}, MeshShading -> {Red, Green}, Exclusions -> Norm[{x, y}] == 1]ℛ = StadiumShape[{{0, 0}, {2, 2}}, 2];RegionNearest[ℛ, {0, 6}]pts = Table[{1, 2} + 5{Cos[k 2 π / 16], Sin[k 2π / 16]}, {k, 0., 15}];
nst = RegionNearest[ℛ, #]& /@ pts;Legended[Graphics[{{Gray, ℛ}, {Thin, Gray, Line[Transpose[{pts, nst}]]}, {Red, Point[pts]}, {Blue, Point[nst]}}], PointLegend[{Red, Blue}, {"start", "nearest"}]]ℛ = StadiumShape[{{0, 0}, {2, 1}}, 1];BoundedRegionQ[ℛ]rr = RegionBounds[ℛ]//QuietGraphics[{Black, ℛ, {EdgeForm[{Dashed, Red}], Opacity[0.1, Yellow], Cuboid@@Transpose[rr]}}]ℛ = StadiumShape[{{0, 0}, {1, 1}}, 1];Integrate[x y, {x, y}∈ℛ]ℛ = StadiumShape[];{MinValue[{x y - x, {x, y}∈ℛ}, {x, y}], ArgMin[{x y - x, {x, y}∈ℛ}, {x, y}]}ℛ = StadiumShape[2];Solve[x^2 + y^2 == 7 && x y == 1 && {x, y}∈ℛ, {x, y}]Show[{Graphics[{{Green, ℛ}, {Blue, Circle[{0, 0}, Sqrt[7]]}}], Plot[1 / x, {x, -3, 5}, PlotRange -> {{-3, 5}, {-3, 6}}], Graphics[{PointSize[Large], Red, Point[{x, y}] /. %}]}, Axes -> True]Applications (4)
Plot a function over a stadium:
Plot3D[Sin[x + Cos[y]], {x, y}∈StadiumShape[]]Create a 3D stadium extrusion with RegionProduct:
ℛ = RegionProduct[StadiumShape[], Line[{{0}, {1}}]];Region[ℛ]Using a series of stadiums (and a disk), create a stick figure:
p0 = {0, 0};p1 = {-6, -6};p2 = {-5, -15};p3 = {-1, -8};
p4 = {1, -16};p5 = {0, 20};p6 = {0, 28};
p7 = {-5, 17};p8 = {-15, 15};p9 = {-7, 22};
p10 = {-14, 21};leg1 = {StadiumShape[{p0, p1}, 1], StadiumShape[{p1, p2}, 1]};
leg2 = {StadiumShape[{p0, p3}, 1], StadiumShape[{p3, p4}, 1]};
back = StadiumShape[{p0, p5}, 1];
neck = {StadiumShape[{p5, p6}, 1], Disk[p6, 5]};
arm1 = {StadiumShape[{p5, p7}, 1], StadiumShape[{p7, p8}, 1]};
arm2 = {StadiumShape[{p5, p9}, 1], StadiumShape[{p9, p10}, 1]};Graphics[{back, leg1, leg2, neck, arm1, arm2}, ImageSize -> {Automatic, 150}]Use RotationTransform to make the stick figure's limbs pivot:
r[region_, point_, angle_] := GeometricTransformation[region, RotationTransform[angle, point]]Manipulate[Graphics[{back, r[leg1, p0, a1], r[leg2, p0, a2], r[neck, p5, a5], r[arm1, p5, a3], r[arm2, p5, a4]}], {{a1, 0, "Left Leg"}, -Pi, Pi}, {{a2, 0, "Right Leg"}, -Pi, Pi}, {{a3, 0, "Lower Arm"}, -Pi, Pi}, {{a4, 0, "Higher Arm"}, -Pi, Pi}, {{a5, 0, "Neck"}, -Pi, Pi}, SaveDefinitions -> True]Make a spring visualization from a collection of stadiums. Make a function that creates a set of stadiums for the front half of the spring and another for the back half, given that each stadium has a horizontal component of ![]() :
:
topstadiums[x_] := Table[StadiumShape[{{(i - 1) * x, -Sqrt[4 - x ^ 2 / 4]}, {(i - 1 / 2) * x, Sqrt[4 - x ^ 2 / 4]}}, .5], {i, 5}];bottomstadiums[x_] = Table[StadiumShape[{{(i - 1 / 2) * x, Sqrt[4 - x ^ 2 / 4]}, {i * x, -Sqrt[4 - x ^ 2 / 4]}}, .5], {i, 5}];Set the top layer of the spring to a lighter gray than the back and make it interactively stretchable using Manipulate:
Manipulate[Graphics[{GrayLevel[.5], bottomstadiums[x], GrayLevel[.7], topstadiums[x]}, PlotRange -> {{-1, 21}, {-3, 3}}, ImageSize -> Medium], {{x, 2, "Push/Pull:"}, 1, 4}, SaveDefinitions -> True]Properties & Relations (6)
Disk is the limit of StadiumShape as p1 approaches p2:
Manipulate[Graphics[{Disk[], StadiumShape[{{2, 0}, {2 + n, 0}}, 1]}, PlotRange -> {{-1, 5}, {-1, 1}}, ImageSize -> Small], {{n, 2}, 2, .00001}]The 3D version of StadiumShape is CapsuleShape:
Graphics3D[CapsuleShape[]]A StadiumShape formed from the RegionUnion of disks and a rectangle:
stadium = RegionUnion[Disk[{0, 0}, 1], Rectangle[{0, -1}, {2, 1}], Disk[{2, 0}, 1]];Region[stadium]The area is the sum of the disk and quadrilateral areas:
Area[stadium]Area[Disk[{0, 0}, 1]] + Area[Rectangle[{0, -1}, {2, 1}]]StadiumShape is all points no more than ![]() from a Line:
from a Line:
Subscript[ℛ, 1] = Line[{{-1, 0}, {1, 0}}];
Subscript[ℛ, 2] = StadiumShape[];Reduce[RegionDistance[Subscript[ℛ, 1], {x, y}] ≤ 1⧦RegionMember[Subscript[ℛ, 2], {x, y}], {x, y}, Reals]ImplicitRegion can represent any StadiumShape:
Subscript[ℛ, 1] = ImplicitRegion[(x | y)∈Reals && r > 0 && ((1 + x)^2 + y^2 ≤ r^2 || (-1 + x)^2 + y^2 ≤ r^2 || (-2 (-1 + x) ≥ 0 && -2 (1 + x) ≤ 0 && -2 r ≤ -2 y ≤ 2 r)), {x, y}];Subscript[ℛ, 2] = StadiumShape[r];RegionEqual[Subscript[ℛ, 1], Subscript[ℛ, 2]]A thick, rounded Line looks like a StadiumShape:
Graphics[{CapForm["Round"], Thickness[1], Line[{{-1, 0}, {1, 0}}]}]Neat Examples (3)
Graphics[Table[{EdgeForm[Black], Hue[RandomReal[]], StadiumShape[RandomReal[10, {2, 2}], RandomReal[1]]}, {40}]]Graphics[Table[{Hue[t / 30, 1, .9, .3], StadiumShape[{{0, 0}, {3Cos[2Pi t / 30], 3Sin[2Pi t / 30]}}, 1]}, {t, 30}]]Graphics[Table[{EdgeForm[Opacity[.6]], Hue[(-11 + q + 10 r) / 72], StadiumShape[{{0, 0}, (8 - r){Cos[2Pi q / 12], Sin[2Pi q / 12]}}, (8 - r) / 3]}, {r, 6}, {q, 12}]]Text
Wolfram Research (2015), StadiumShape, Wolfram Language function, https://reference.wolfram.com/language/ref/StadiumShape.html.
CMS
Wolfram Language. 2015. "StadiumShape." Wolfram Language & System Documentation Center. Wolfram Research. https://reference.wolfram.com/language/ref/StadiumShape.html.
APA
Wolfram Language. (2015). StadiumShape. Wolfram Language & System Documentation Center. Retrieved from https://reference.wolfram.com/language/ref/StadiumShape.html