

HalfLine
Details
- HalfLine is also known as ray.
- HalfLine can be used as a geometric region and graphics primitive.
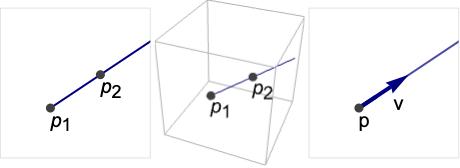
- HalfLine represents a linear curve
 or
or  .
. - HalfLine can be used in Graphics and Graphics3D.
- HalfLine will be clipped by PlotRange when rendering.
- In graphics, the points p, pi and vector v can be Dynamic expressions.
- Graphics rendering is affected by directives such as Thickness, Dashing, and color.
- HalfLine can be used with symbolic points in GeometricScene.
Examples
open all close allBasic Examples (3)
A HalfLine in 2D:
Graphics[HalfLine[{{0, 0}, {1, 0}}], Frame -> True]Graphics3D[HalfLine[{0, 0, 0}, {1, 2, 3}]]Different styles applied to a half-line:
ℛ = HalfLine[{0, 0}, {1, 1}];{Graphics[{Red, ℛ}], Graphics[{Thick, Red, ℛ}], Graphics[{Thick, Red, Dashed, ℛ}]}The arc length of a half-line is infinite:
ArcLength[HalfLine[{0, 0}, {1, 1}]]Scope (18)
Graphics (9)
Specification (3)
Define a HalfLine starting at ![]() in the direction
in the direction ![]() :
:
ill = Graphics[{PointSize[Medium], Point[{{1, 1}}], Arrowheads[Medium], Thick, Arrow[{{1, 1}, {3, 2}}]}, PlotRange -> {{0, 4}, {0, 3}}, Frame -> True];Show[ill, Graphics[HalfLine[{1, 1}, {2, 1}]]]Define the same half-line starting at ![]() and passing through
and passing through ![]() :
:
ill = Graphics[{PointSize[Medium], Point[{{1, 1}, {3, 2}}]}, PlotRange -> {{0, 4}, {0, 3}}, Frame -> True];Show[ill, Graphics[HalfLine[{{1, 1}, {3, 2}}]]]Define a 3D half-line starting at ![]() and going in the direction
and going in the direction ![]() :
:
ill = Graphics3D[{PointSize[Medium], Point[{{1, 1, 1}}], Arrowheads[Medium], Thick, Arrow[{{1, 1, 1}, {2, 3, 4}}]}, PlotRange -> {{0, 5}, {0, 5}, {0, 5}}, Axes -> True];Show[ill, Graphics3D[HalfLine[{1, 1, 1}, {1, 2, 3}]]]Define the same half-line using the points ![]() and
and ![]() :
:
ill = Graphics3D[{PointSize[Medium], Point[{{1, 1, 1}, {2, 3, 4}}]}, PlotRange -> {{0, 5}, {0, 5}, {0, 5}}, Axes -> True];Show[ill, Graphics3D[HalfLine[{{1, 1, 1}, {2, 3, 4}}]]]A half-line with symbolic direction:
Table[Graphics[HalfLine[{0, 0}, {Cos[θ], Sin[θ]}], ImageSize -> Tiny, PlotLabel -> θ], {θ, 0, π, π / 4}]Styling (5)
A HalfLine with varying thickness:
Table[Graphics[{Thickness[i], HalfLine[{{0, 0}, {2, 1}}]}], {i, {Tiny, Small, Medium, Large}}]Table[Graphics[{t, HalfLine[{{0, 0}, {2, 1}}]}], {t, {Thin, Thick}}]Table[Graphics[{Thickness[i], HalfLine[{{0, 0}, {2, 1}}]}], {i, {.005, .05, .1}}]Thickness in printer's points:
Table[Graphics[{AbsoluteThickness[i], HalfLine[{{0, 0}, {2, 1}}]}], {i, {1, 5, 10}}]Half-lines can be rendered in dashed or dotted styles:
Table[Graphics[{Dashing[i], HalfLine[{{0, 0}, {2, 1}}]}], {i, {Tiny, Small, Medium, Large}}]Table[Graphics[{d, HalfLine[{{0, 0}, {2, 1}}]}], {d, {Dotted, Dashed, DotDashed}}]Color directives can be used to specify the color of a half-line:
Table[Graphics[{c, HalfLine[{{0, 0}, {2, 1}}]}], {c, {Red, Green, Blue, Yellow}}]Combine various directives to style a half-line:
Graphics[{Thick, Blue, Dashed, HalfLine[{{0, 0}, {2, 1}}]}]Coordinates (1)
Points and vectors can be Dynamic:
DynamicModule[{θ = 0}, {Slider[Dynamic[θ], {0, 2Pi}], Graphics[HalfLine[{0, 0}, Dynamic[{Cos[θ], Sin[θ]}]]]}]Regions (9)
Embedding dimension is the dimensionality of the vertices:
RegionEmbeddingDimension[HalfLine[{-1, -1}, {1, 1}]]RegionEmbeddingDimension[HalfLine[{0, 0, 0}, {1, 1, 1}]]Geometric dimension is the dimension of the region itself:
RegionDimension[HalfLine[{-1, 1}, {1, 1}]]ℛ = HalfLine[{0, 0}, {1, 1}];{RegionMember[ℛ, {2, 2}], RegionMember[ℛ, {3, 4}]}Get conditions for membership:
RegionMember[ℛ, {x, y}]A half-line has infinite measure and undefined centroid:
ℛ = HalfLine[{0, 0}, {1, 1}];RegionMeasure[ℛ]RegionCentroid[ℛ]Computing distance to a half-line:
ℛ = HalfLine[{0, 0}, {1, 1}];RegionDistance[ℛ, {1, 2}]{Plot3D[Evaluate@RegionDistance[ℛ, {x, y}], {x, -1, 1}, {y, -1, 1}, MeshFunctions -> {#3&}, Mesh -> 5],
ContourPlot[Evaluate[RegionDistance[ℛ, {x, y}]], {x, -3, 3}, {y, -3, 3}, Contours -> {{0.5, Red}, {1, Green}, {1.5, Blue}}]}ℛ = HalfLine[{0, 0}, {1, 2}];RegionNearest[ℛ, {1, 1}]pts = Table[{0, 0} + {Cos[k 2 π / 16], Sin[k 2π / 16]}, {k, 0, 15}];
nst = RegionNearest[ℛ, #]& /@ pts;Legended[Graphics[{{Thick, Gray, ℛ}, {Thin, Gray, Line[Transpose[{pts, nst}]]}, {Red, Point[pts]}, {Blue, Point[nst]}}], PointLegend[{Red, Blue}, {"start", "nearest"}]]ℛ = HalfLine[{0, 0, 0}, {1, 1, 0}];BoundedRegionQ[ℛ]But its range is not necessarily unbounded in all dimensions:
RegionBounds[ℛ]ℛ = HalfLine[{1, 1}, {1, 1}];Integrate[(1 / (x y))^2, {x, y}∈ℛ]ℛ = HalfLine[{0, 0}, {1, 1}];Minimize[{(x y - 1)^2 + 3, {x, y}∈ℛ}, {x, y}]Solve equations on a half-line:
ℛ = HalfLine[{0, 0, 0}, {1, 2, 3}];Reduce[x^2 + y^2 + z^2 == 1 && {x, y, z}∈ℛ, {x, y, z}]Applications (4)
Create parallel rays aligned to ![]() :
:
rays = Table[HalfLine[{0, y}, {1, 1}], {y, 5}];Graphics[rays, PlotRange -> {{-6, 6}, {0, 6}}]Create rays perpendicular to the unit circle:
rays = Table[HalfLine[{Cos[ϕ], Sin[ϕ]}, {Cos[ϕ], Sin[ϕ]}], {ϕ, 0, 2Pi, 2Pi / 100}];Graphics[rays]asym = HalfLine[{0, 0}, {1, 1}];Plot[(1/x) + Abs[x], {x, -2, 7}, Epilog -> {Red, Dashed, asym}]pt = {0.7, 0.7 ^ 2};Plot[x ^ 2, {x, -1, 1}, Epilog -> {Red, HalfLine[pt, {-1, 0}], HalfLine[pt, {0, -1}]}]Properties & Relations (4)
Any InfiniteLine is a union of two half-lines:
Subscript[ℛ, 1] = InfiniteLine[{1, 0}, {1, 2}];Subscript[ℛ, 2] = RegionUnion[HalfLine[{1, 0}, {1, 2}], HalfLine[{1, 0}, {-1, -2}]];RegionEqual[Subscript[ℛ, 1], Subscript[ℛ, 2]]ParametricRegion can represent any HalfLine:
Subscript[ℛ, 1] = ParametricRegion[{t + 1, 2t}, {{t, 0, ∞}}];Subscript[ℛ, 2] = HalfLine[{1, 0}, {1, 2}];RegionEqual[Subscript[ℛ, 1], Subscript[ℛ, 2]]ImplicitRegion can represent any HalfLine:
Subscript[ℛ, 1] = ImplicitRegion[1 - x ≤ 0 && 1 + x - y == 0, {x, y}];Subscript[ℛ, 2] = HalfLine[{{1, 2}, {3, 4}}];RegionEqual[Subscript[ℛ, 1], Subscript[ℛ, 2]]HalfLine is a special case of ConicHullRegion:
chr = ConicHullRegion[{{0, 0}}, {{1, 1}}];hline = HalfLine[{0, 0}, {1, 1}];RegionEqual[chr, hline]Neat Examples (3)
A random collection of half-lines:
Graphics[Table[{Hue[RandomReal[]], HalfLine[RandomReal[1, 2], RandomReal[{-1, 1}, 2]]}, {100}]]An organized collection of half-lines:
Graphics[Table[HalfLine[{Cos[θ], Sin[θ]}, {-Sin[θ], Cos[θ]}], {θ, 0, 2π, π / 20}], PlotRange -> 2]Graphics[Table[HalfLine[{Cos[ϕ], Sin[ϕ]}, {Sin[ϕ], Cos[ϕ]}], {ϕ, 0, 2Pi, 2Pi / 200}], PlotRange -> 3]Text
Wolfram Research (2014), HalfLine, Wolfram Language function, https://reference.wolfram.com/language/ref/HalfLine.html.
CMS
Wolfram Language. 2014. "HalfLine." Wolfram Language & System Documentation Center. Wolfram Research. https://reference.wolfram.com/language/ref/HalfLine.html.
APA
Wolfram Language. (2014). HalfLine. Wolfram Language & System Documentation Center. Retrieved from https://reference.wolfram.com/language/ref/HalfLine.html