

HalfPlane
Details
- HalfPlane is also known as half-space in 2D.
- HalfPlane can be used as a geometric region and graphics primitive.
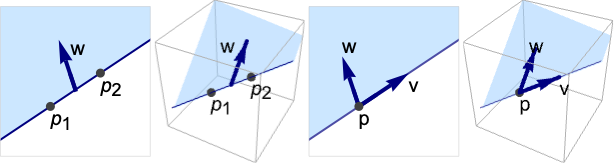
- HalfPlane represents a planar region
 or
or  .
. - HalfPlane can be used in Graphics and Graphics3D.
- HalfPlane will be clipped by PlotRange when rendering.
- In graphics, the points p, pi and vector v can be Scaled and Dynamic expressions.
- Graphics rendering is affected by directives such as FaceForm, EdgeForm, Opacity, and color.
- FaceForm[front,back] can be used to specify different styles for the front and back in 3D. The front is defined by the right-hand rule and the direction from {p1,w,p2} or {p,v,w}.
Examples
open all close allBasic Examples (4)
A HalfPlane in 2D:
Graphics[HalfPlane[{{0, 0}, {1, 0}}, {0, 1}], Frame -> True]Graphics3D[HalfPlane[{{0, 0, 0}, {1, 0, 0}}, {0, 1, 1}]]Different styles applied to a half-plane:
ℛ = HalfPlane[{0, 0}, {1, -1}, {1, 1}];{Graphics[{Pink, ℛ}], Graphics[{EdgeForm[Thick], Pink, ℛ}], Graphics[{EdgeForm[Dashed], Pink, ℛ}], Graphics[{EdgeForm[Directive[Thick, Dashed, Blue]], Pink, ℛ}]}The Area of a half-plane is infinite:
Area[HalfPlane[{{0, 0}, {1, 0}}, {0, 1}]]Determine if points belong to a given half-plane:
ℛ = HalfPlane[{0, 0}, {1, 0}, {0, 1}];{RegionMember[ℛ, {1, 1}], RegionMember[ℛ, {1, -1}]}Scope (18)
Graphics (8)
Specification (3)
Define the upper half-plane using a point and two vectors:
ill = Graphics[{PointSize[Medium], Point[{{0, 0}}], Arrowheads[Medium], Thick, Arrow[{{0, 0}, {1, 0}}], Arrow[{{0, 0}, {0, 1}}]}];Show[Graphics[{Pink, HalfPlane[{0, 0}, {1, 0}, {0, 1}]}, PlotRange -> {{-1, 2}, {-1, 2}}, Frame -> True], ill]Or using two points and a single vector:
ill = Graphics[{PointSize[Medium], Point[{{0, 0}, {1, 0}}], Arrowheads[Medium], Thick, Arrow[{{0, 0}, {0, 1}}]}];Show[Graphics[{Pink, HalfPlane[{{0, 0}, {1, 0}}, {0, 1}]}, PlotRange -> {{-1, 2}, {-1, 2}}, Frame -> True], ill]Define a half-plane in 3D using a point and two vectors:
ill = Graphics3D[{PointSize[Medium], Point[{{0, 1, 3}}], Arrowheads[Medium], Thick, Arrow[{{0, 1, 3}, {1, 0, 1}}], Arrow[{{0, 1, 3}, {1, 2, 3}}]}, PlotRange -> {{-1, 2}, {-1, 3}, {0, 4}}, Axes -> True];Show[ill, Graphics3D[HalfPlane[{0, 1, 3}, {1, -1, -2}, {1, 1, 0}]]]Or using two points and a single vector:
ill = Graphics3D[{PointSize[Medium], Point[{{0, 1, 3}, {1, 0, 1}}], Arrowheads[Medium], Thick, Arrow[{{0, 1, 3}, {1, 2, 3}}]}, PlotRange -> {{-1, 2}, {-1, 3}, {0, 4}}, Axes -> True];Show[ill, Graphics3D[HalfPlane[{{0, 1, 3}, {1, 0, 1}}, {1, 1, 0}]]]A half-plane with symbolic parameters:
Table[Graphics[HalfPlane[{0, 0}, {Cos[θ], Sin[θ]}, {Sin[θ], -Cos[θ]}], ImageSize -> Tiny, PlotLabel -> θ], {θ, 0, π, π / 4}]Styling (2)
Color directives specify the color of the half-plane:
Table[Graphics[{c, HalfPlane[{0, 0}, {1, 1}, {0, 1}]}], {c, {Red, Green, Blue, Yellow}}]Table[Graphics3D[{c, HalfPlane[{0, 1, 3}, {1, -1, -2}, {1, 1, 0}]}, PlotRange -> {{-1, 2}, {-1, 3}, {0, 4}}], {c, {Red, Green, Blue, Yellow}}]FaceForm and EdgeForm can be used to specify the styles of the faces and edges:
Graphics[{FaceForm[Pink], EdgeForm[Directive[Dashed, Thick, Blue]], HalfPlane[{0, 0}, {1, 1}, {0, 1}]}]Graphics3D[{FaceForm[Pink], EdgeForm[Directive[Dashed, Thick, Blue]], HalfPlane[{0, 1, 3}, {1, -1, -2}, {1, 1, 0}]}, PlotRange -> {{-1, 2}, {-1, 3}, {0, 4}}]Coordinates (3)
Specify coordinates by fractions of the plot range:
Graphics[HalfPlane[{Scaled[{0, 0.25}], Scaled[{1, 0.5}]}, Scaled[{0, 1}]], PlotRange -> {{0, 10}, {0, 10}}, Frame -> True]Graphics3D[HalfPlane[{Scaled[{0, 0.25, 0}], Scaled[{1, 0.5, 1}]}, Scaled[{0, 1, 1}]], PlotRange -> {{0, 10}, {0, 10}, {0, 10}}, Axes -> True]Specify scaled offsets from the ordinary coordinates in 2D:
Graphics[HalfPlane[{Scaled[{0, 0.5}, {2, 0}], Scaled[{0, 0.5}, {1, 2}]}, Scaled[{0, 1}]], PlotRange -> {{0, 4}, {0, 4}}, Frame -> True]Points and vectors can be Dynamic:
DynamicModule[{θ = 0}, {Slider[Dynamic[θ], {0, Pi}], Graphics[HalfPlane[{{0, 0}, Dynamic[{Cos[θ], Sin[θ]}]}, {1, 1}]]}]Regions (10)
Embedding dimension is the dimension of the coordinates:
RegionEmbeddingDimension[HalfPlane[{0, 0}, {1, 0}, {0, 1}]]RegionEmbeddingDimension[HalfPlane[{0, 0, 0}, {1, 0, 0}, {1, 1, 0}]]Geometric dimension is the dimension of the region itself:
RegionDimension[HalfPlane[{0, 0}, {1, 0}, {1, 1}]]ℛ = HalfPlane[{0, 0}, {1, 0}, {0, 1}];{RegionMember[ℛ, {1, 5}], RegionMember[ℛ, {1, -5}]}Get conditions for membership:
RegionMember[ℛ, {x, y}]Half-planes have infinite measure and undefined centroid:
ℛ = HalfPlane[{0, 0}, {1, 0}, {0, 1}];RegionMeasure[ℛ]RegionCentroid[ℛ]Distance from a point to a half-plane:
ℛ = HalfPlane[{0, 0}, {1, 0}, {0, 1}];RegionDistance[ℛ, {2, -3}]{Plot3D[RegionDistance[ℛ, {x, y}], {x, -1, 1}, {y, -1, 1}, MeshFunctions -> {#3&}, Mesh -> 5, Exclusions -> y == 0], ContourPlot[Evaluate@RegionDistance[ℛ, {x, y}], {x, -2, 2}, {y, -2, 2}, Contours -> {{0.5, Red}, {1, Green}, {1.5, Blue}}]}Signed distance to a half-plane:
ℛ = HalfPlane[{0, 0}, {1, 0}, {0, 1}];{SignedRegionDistance[ℛ, {2, -3}], SignedRegionDistance[ℛ, {2, 3}]}Plot3D[SignedRegionDistance[ℛ, {x, y}], {x, -1, 1}, {y, -1, 1}, MeshFunctions -> {#3&}, Mesh -> 5, Exclusions -> y == 0]ℛ = HalfPlane[{0, 0}, {1, -1}, {1, 1}];RegionNearest[ℛ, {2, -3}]pts = Table[{Cos[k 2 π / 16], Sin[k 2 π / 16]}, {k, 0, 15}];
nst = RegionNearest[ℛ, #]& /@ pts;Legended[Graphics[{{Gray, ℛ}, {Thin, Gray, Line[Transpose[{pts, nst}]]}, {Red, Point[pts]}, {Blue, Point[nst]}}], PointLegend[{Red, Blue}, {"start", "nearest"}]]ℛ = HalfPlane[{0, 0}, {1, 0}, {0, 1}];BoundedRegionQ[ℛ]RegionBounds[ℛ]ℛ = HalfPlane[{0, 0}, {1, 0}, {0, 1}];Integrate[Exp[-x^2 - y^2], {x, y}∈ℛ]ℛ = HalfPlane[{0, 0}, {1, 0}, {0, 1}];Minimize[{(x - 1 / 2)^2(y - 1 / 4)^2 + 1, {x, y}∈ℛ}, {x, y}]Solve equations over a half-plane:
ℛ = HalfPlane[{0, 0}, {1, 0}, {0, 1}];Reduce[x^2 + y^2 == 1 && {x, y}∈ℛ, {x, y}]Applications (3)
Define regions that occupy two adjacent quadrants:
hpl = {HalfPlane[{{0, 0}, {1, 0}}, {0, 1}], HalfPlane[{{0, 0}, {1, 0}}, {0, -1}], HalfPlane[{{0, 0}, {0, 1}}, {1, 0}], HalfPlane[{{0, 0}, {0, 1}}, {-1, 0}]};Graphics[{Opacity@0.3, #}, Axes -> True]& /@ hplPartition space in a BubbleChart:
b = BubbleChart3D[RandomReal[1, {20, 4}]];hpl = Table[HalfPlane[{0.5, 0, 0.5}, {0, 0.5, 0}, w], {w, {{0, 0, -1}, {-1, 0, 1}, {1, 0, 1}}}];Show[b, Graphics3D[{Opacity@0.6, hpl}]]Find the intersection points of a sphere, a half-plane, and a surface defined by ![]() :
:
Subscript[ℛ, 1] = Sphere[];
Subscript[ℛ, 2] = HalfPlane[{0, 0, 0}, {0, 1, 0}, {1, 0, 1}];pts = Solve[2 x y == z^2 && {x, y, z}∈Subscript[ℛ, 1] && {x, y, z}∈Subscript[ℛ, 2], {x, y, z}, Reals]Visualize intersection points:
intersections = {PointSize[Large], Red, Point[{x, y, z} /. pts]};r1 = {Opacity[0.5, LightBlue], Subscript[ℛ, 1]};r2 = {Opacity[0.5, Yellow], Subscript[ℛ, 2]};r3 = ContourPlot3D[2 x y == z^2, {x, -1.2, 1.2}, {y, -1.2, 1.2}, {z, -1.2, 1.2}, Mesh -> None, ContourStyle -> Opacity[0.5]];Show[{Graphics3D[{r1, r2, intersections}], r3}, Boxed -> False]Properties & Relations (4)
Any HalfPlane can be represented by ConicHullRegion:
Subscript[ℛ, 1] = HalfPlane[{{0, 1, 3}, {1, 0, 1}}, {1, 1, 0}];Subscript[ℛ, 2] = ConicHullRegion[{{0, 1, 3}, {1, 0, 1}}, {{1, 1, 0}}];RegionEqual[Subscript[ℛ, 1], Subscript[ℛ, 2]]ImplicitRegion can be used to represent any HalfPlane:
Subscript[ℛ, 1] = HalfPlane[{1, 1}, {1, 2}, {2, -1}];Subscript[ℛ, 2] = ImplicitRegion[1 - 2x + y ≤ 0, {x, y}];RegionEqual[Subscript[ℛ, 1], Subscript[ℛ, 2]]ParametricRegion can be used to represent any HalfPlane:
Subscript[ℛ, 1] = HalfPlane[{1, 1}, {1, 2}, {2, -1}];Subscript[ℛ, 2] = ParametricRegion[{1, 1} + u{1, 2} + v{2, -1}, {{u, -∞, ∞}, {v, 0, ∞}}];RegionEqual[Subscript[ℛ, 1], Subscript[ℛ, 2]]Any InfinitePlane can be represented as a union of two half-planes:
Subscript[ℛ, 1] = InfinitePlane[{0, 1, 3}, {{1, -1, -2}, {1, 1, 0}}];Subscript[ℛ, 2] = RegionUnion[HalfPlane[{0, 1, 3}, {1, -1, -2}, {1, 1, 0}], HalfPlane[{0, 1, 3}, {1, -1, -2}, {-1, -1, 0}]];RegionEqual[Subscript[ℛ, 1], Subscript[ℛ, 2]]Text
Wolfram Research (2014), HalfPlane, Wolfram Language function, https://reference.wolfram.com/language/ref/HalfPlane.html (updated 2016).
CMS
Wolfram Language. 2014. "HalfPlane." Wolfram Language & System Documentation Center. Wolfram Research. Last Modified 2016. https://reference.wolfram.com/language/ref/HalfPlane.html.
APA
Wolfram Language. (2014). HalfPlane. Wolfram Language & System Documentation Center. Retrieved from https://reference.wolfram.com/language/ref/HalfPlane.html