

MeanFilter
MeanFilter[data,r]
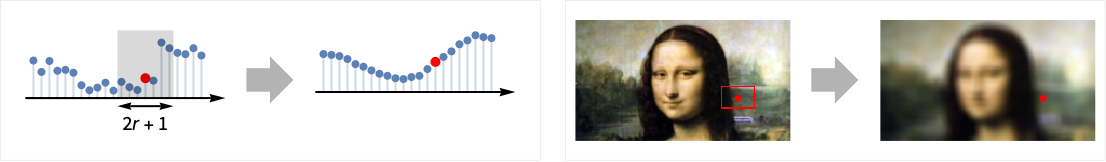
filters data by replacing every value by the mean value in its range-r neighborhood.
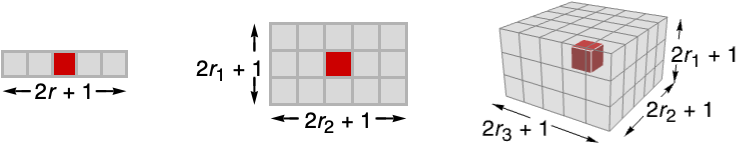
MeanFilter[data,{r1,r2,…}]
uses ri for filtering the ![]()
![]() dimension in data.
dimension in data.
Details
- MeanFilter is used to locally smooth data and diminish noise, where the amount of smoothing is dependent on the value of r.
- The function applied to each range-r neighborhood is Mean.
- The data can be any of the following:
-
list arbitrary-rank numerical array tseries temporal data such as TimeSeries, TemporalData, … image arbitrary Image or Image3D object audio an Audio object video a Video object - For multichannel images and audio signals, MeanFilter operates separately on each channel.
- MeanFilter[data,{r1,r2,…}] computes the mean value in
 blocks centered on each sample.
 - MeanFilter assumes the index coordinate system for lists and images.
- At the data boundaries, MeanFilter uses smaller neighborhoods.
Examples
open all close allBasic Examples (3)
MeanFilter[{1, 2, 3, 2, 1}, 1]Filter a TimeSeries:
ts = TemporalData[TimeSeries, {{{0., -0.054108337548928784, 0.1280211704499059, 0.28162021808461324,
    -0.2057320325139802, -0.4871901025739722, -0.7154387408784426, -0.7399660905024047,
    -0.6981022018441507, -0.7178077145466483, -0.8034462541874 ... 7894984276149, 1.8851123992920942, 1.8341759268762767, 2.0335844117979263}},
  {{0., 10., 0.1}}, 1, {"Continuous", 1}, {"Continuous", 1}, 1,
  {ValueDimensions -> 1, ResamplingMethod -> {"Interpolation", InterpolationOrder -> 1}}}, False,
10.];filtered = MeanFilter[ts, 0.5]ListLinePlot[{ts, filtered}, PlotLegends -> {"original data", "filtered"}]MeanFilter[[image], 4]Scope (13)
Data (8)
Mean filtering of a numeric vector:
MeanFilter[{0, 3, 8, 2}, 1]MeanFilter[{a, b, c, d}, 1]MeanFilter[(| | | | |
| - | - | - | - |
| 0 | 3 | 8 | 2 |
| 7 | 6 | 9 | 6 |
| 5 | 8 | 4 | 0 |
| 3 | 5 | 1 | 6 |), 1]//MatrixFormMean filtering of a list of Quantity objects:
data = {Quantity[9, "Feet"], Quantity[86, "Inches"], Quantity[27.1, "Meters"], Quantity[79, "Feet"], Quantity[90, "Feet"], Quantity[41, "Inches"], Quantity[99, "Inches"], Quantity[6, "Feet"], Quantity[38, "Feet"], Quantity[89, "Feet"], Quantity[53, "Feet"], Quantity[85, "Meters"], Quantity[92, "Meters"], Quantity[95, "Meters"], Quantity[49, "Feet"]};ListLinePlot[{data, MeanFilter[data, 3]}]Filter an Audio signal:
a = Import["ExampleData/rule30.wav"];b = MeanFilter[a, 35]AudioPlot[{a, b}]Filtering a 2D grayscale image:
MeanFilter[[image], 3]MeanFilter[Video["ExampleData/fish.mp4"], 5]Mean filtering of a 3D volume:
MeanFilter[[image], 4]Parameters (5)
Specify one radius to be used in all directions:
MeanFilter[[image], 5]Increasing the radius will result in smoother images:
Table[Labeled[MeanFilter[[image], r], Text["*r* = " <> ToString@r]], {r, {2, 5, 10}}]Mean filtering just in the first direction:
MeanFilter[[image], {10, 0}]MeanFilter[[image], {0, 10}]Mean filtering of a 3D image in the vertical direction only:
MeanFilter[[image], {4, 0, 0}]Filtering of the horizontal planes only:
MeanFilter[[image], {0, 4, 4}]Use a quantity parameter with a TimeSeries input:
data = TimeSeries[FinancialData["AAPL", {{2016, 7, 1}, {2017, 1, 1}, "Day"}]]DateListPlot[{data, MeanFilter[data, Quantity[5, "Days"]]}]Applications (3)
Use MeanFilter to smooth a time series and identify the trend:
ts = TemporalData[TimeSeries, {{{-0.8957692225439533, -1.840000908953453, -3.03432343926567,
    -3.7256481235845382, -5.389803445107346, -6.3021740539906395, -7.9922373743507515,
    -10.206506217563044, -12.111887291773607, -10.595028153543062, -11. ... .88204639122333, -72.98259712435014, -74.5669904898752,
    -73.14375080767493, -73.9422804090023, -73.59498797717636}}, {{0, 782, 1}}, 1,
  {"Continuous", 1}, {"Discrete", 1}, 1, {ValueDimensions -> 1, ResamplingMethod -> None}}, False,
10.1];ListLinePlot[ts]res = Table[MeanFilter[ts, r], {r, {10, 50, 100}}];ListLinePlot[Join[{ts}, res], PlotLegends -> {"data", "r = 10", "r = 50", "r = 100"}]Denoise an ultrasound image with mean filtering:
MeanFilter[[image], 2]Unsharp masking using mean filtering:
i = [image];
ImageAdd[i, ImageSubtract[i, MeanFilter[i, 15]]]
Properties & Relations (5)
Compare filtering results using geometric, harmonic and standard mean filters:
Labeled[ImageAdjust[#[[image], 7]], Text[#]]& /@ {GeometricMeanFilter, HarmonicMeanFilter, MeanFilter}For positive data, HarmonicMeanFilter[data,r]≤GeometricMeanFilter[data,r]≤MeanFilter[data,r]:
data = RandomReal[1, 50];
ListLinePlot[{MeanFilter[data, 5], GeometricMeanFilter[data, 5], HarmonicMeanFilter[data, 5]}, PlotRange -> {0, 1}, PlotLegends -> {"mean", "geometric mean", "harmonic mean"}]
MeanFilter is equivalent to ListConvolve with a moving-average filter of length ![]() , if
, if ![]() samples are removed from the border:
samples are removed from the border:
r = 1;
x = {1, 0, -1, 1, 2, 3, 1, -1, 0, 1};
MeanFilter[x, r][[r + 1 ;; -r - 1]] == ListConvolve[ConstantArray[1 / (2r + 1), 2r + 1], x]
However, ListConvolve is substantially faster:
data = RandomReal[1, 10^5];
RepeatedTiming[MeanFilter[data, 1];]//FirstRepeatedTiming[ListConvolve[{1, 1, 1} / 3., data];]//FirstMeanFilter is a frequency-selective filter with a lowpass characteristic:
a = AudioGenerator["White"]Periodogram[MeanFilter[a, 10]]Use MedianFilter to avoid excessive edge blurring:
i = [image];{MeanFilter[i, 4], MedianFilter[i, 4]}Text
Wolfram Research (2008), MeanFilter, Wolfram Language function, https://reference.wolfram.com/language/ref/MeanFilter.html (updated 2025).
CMS
Wolfram Language. 2008. "MeanFilter." Wolfram Language & System Documentation Center. Wolfram Research. Last Modified 2025. https://reference.wolfram.com/language/ref/MeanFilter.html.
APA
Wolfram Language. (2008). MeanFilter. Wolfram Language & System Documentation Center. Retrieved from https://reference.wolfram.com/language/ref/MeanFilter.html