


Region
Details and Options
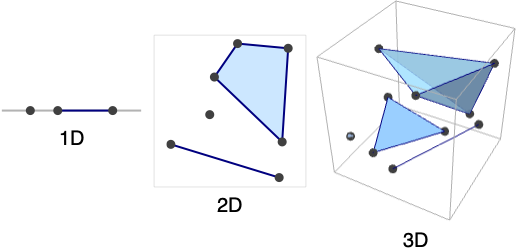
- Region[…] displays in a notebook as a plot of a region with embedding dimensions 1, 2 and 3.
- Region[reg,…] is always converted to an optimized standard form with structure Region[reg,data,…].
- Region has the same options as Graphics for embedding dimension 2 and the same options as Graphics3D for embedding dimension 3, with the following additions and changes:
-
PlotTheme $PlotTheme overall theme RegionSize Automatic print size of the region - Possible settings for PlotTheme include common base themes, font features themes and size features themes.
- Region can be used with functions such as RegionMember, RegionDistance, RegionMeasure and NIntegrate.
Examples
open all close allBasic Examples (3)
Region[Disk[]]A MeshRegion is a Region with an additional mesh structure:
ℛ = DelaunayMesh[RandomReal[1, {50, 3}]]RegionQ[ℛ]Region represents the underlying three-dimensional point set without the mesh structure:
Region[ℛ]Style a Region:
Region[Style[Disk[], Green]]Scope (35)
Regions (14)
Regions in 1D (3)
A strictly 0D Region is a point set:
Region[MeshRegion[{{0}, {1}, {2}}, Point[{{1}, {2}, {3}}]]]A strictly 1D Region is a collection of line segments:
Region[MeshRegion[{{0}, {1}, {2}}, Line[{1, 2, 3}]]]A Region can combine elements of different dimensions:
Region[MeshRegion[{{0}, {1}, {2}}, {Point[{1}], Line[{2, 3}]}]]Regions in 2D (5)
A strictly 0D Region is a point set:
Region[Point[{{0, 0}, {1, 1}, {2, 2}, {3, 3}}]]A strictly 1D Region is a collection of line segments:
Region[MeshRegion[{{0, 0}, {1, 0}, {0, 1}, {1, 1}, {2, 1}}, Line[{{1, 2, 3, 1}, {4, 5}}]]]A strictly 2D Region is a collection of polygonal faces:
Region[RegionUnion[Rectangle[{1, 1}], Triangle[]]]A Region can combine elements of different dimensions:
Region[RegionUnion[Point[{{2, 0}}], Line[{{2, 1}, {1, 0}}], Triangle[]]]Polygons with GeoGridPosition:
Region[Polygon[GeoGridPosition[{{{-0.9950503945490105, 1.2366760550756015},
   {-0.9952074890903578, 1.2369207053693891}, {-0.9952196732768064, 1.2369073327446167},
   {-0.9953160063787643, 1.236848436956935}, {-0.9954141759436825, 1.2369993898475449},
   {-0. ... 197645333103}, {-0.9949098578570917, 1.2368130881428654},
   {-0.9948663952535768, 1.2367477711687371}, {-0.9948714472169538, 1.2367426500757825},
   {-0.9949211061652593, 1.2367089232486177}, {-0.9949439717990124, 1.236746107097628}}}, "Bonne"]]]
Regions in 3D (6)
A strictly 0D Region is a point set:
Region[Point[Table[{t, Sin[t], Cos[t]}, {t, 0, 2π, 2π / 10}]]]A strictly 1D Region is a collection of line segments:
Region[MeshRegion[{{0, 0, 0}, {1, 0, 0}, {0, 1, 0}, {0, 0, 1}}, Line[Union[Sort /@ Permutations[Range[4], {2}]]]]]A strictly 2D Region is a collection of polygonal faces:
Region[MeshRegion[{{0, 0, 0}, {1, 0, 0}, {0, 1, 0}, {0, 0, 1}}, Polygon[{{1, 3, 2}, {4, 2, 3}, {3, 1, 4}}]]]A strictly 3D Region is a collection of polyhedral volumes:
Region[Simplex[{{0, 0, 1}, {1, 0, 0}, {1, 0, 1}, {1, 1, 1}}]]Polyhedral volume cells include Cone, Cuboid, Pyramid etc.:
Region[RegionUnion[Cone[], Cuboid[]]]A Region can combine elements of different dimensions:
Region[RegionUnion[Point[{{2, 0, 0}}], Line[{{2, 1, 1}, {1, 0, 1}}], Triangle[{{0, 0, 2}, {1, 0, 2}, {1, 2, 1}}], Simplex[{{0, 0, 1}, {1, 0, 0}, {1, 0, 1}, {1, 1, 1}}]]]PolygonCoordinates works on polygons of geographic entities:
Region[Polygon[["france"]]]Polygons with GeoPosition:
Region[Polygon[GeoPosition[{{{40.083441, -88.235716}, {40.083607, -88.257488}, {40.082603, -88.257149},
   {40.076136999999996, -88.25740499999999}, {40.076178, -88.270888}, {40.076516, -88.271558},
   {40.083686, -88.271512}, {40.083659999999995, -88.267046},  ... 33323}, {40.098112, -88.228687},
   {40.095216, -88.228627}, {40.095179, -88.238547}, {40.094480999999995, -88.238546},
   {40.094508999999995, -88.23267}, {40.094106, -88.232556}, {40.090666999999996, -88.232477},
   {40.090741, -88.235745}}}]]]
Polygons with GeoPositionXYZ:
Region[Polygon[GeoPositionXYZ[{{{150451.6968462432, -4.884430486484052*^6, 4.085078564164219*^6},
   {148595.27532671497, -4.884475441490381*^6, 4.085092666620835*^6},
   {148626.35829777512, -4.884546311005128*^6, 4.0850073717259285*^6},
   {148618.5908634042 ... 7*^6, 4.0860187668081024*^6},
   {150697.56410771207, -4.8836599487428395*^6, 4.085984535480795*^6},
   {150711.88303095422, -4.883905546449982*^6, 4.0856924143435075*^6},
   {150433.15479548014, -4.883908845676418*^6, 4.0856987003255524*^6}}}]]]
Polygons with GeoPositionENU:
Region[Polygon[GeoPositionENU[{{{3378.2547059731055, -3369.2234780923936, -0.7440009205072329},
   {1521.3211635380246, -3351.391253626573, -0.022340134218666208},
   {1550.2571145363192, -3462.8657556618973, -0.08899812728964207},
   {1528.5672303494055, -418 ... 63383291193, -0.37494203351275246},
   {3654.121991908476, -2566.7472331234085, -0.5214977847472255},
   {3375.420726854886, -2558.6597093173914, -0.3648706331350695}}},
 GeoPosition[{40.11379115639895, -88.2753251202516, -1.0415787873318691}]]]]
Presentation (8)
Region[Pyramid[{{0, 0, 0}, {2, 0, 0}, {2, 2, 0}, {0, 2, 0}, {1, 1, 2}}], PlotTheme -> "Monochrome"]Region[Pyramid[{{0, 0, 0}, {2, 0, 0}, {2, 2, 0}, {0, 2, 0}, {1, 1, 2}}], PlotTheme -> "Detailed"]Region[Pyramid[{{0, 0, 0}, {2, 0, 0}, {2, 2, 0}, {0, 2, 0}, {1, 1, 2}}], PlotTheme -> "Business"]Region[Pyramid[{{0, 0, 0}, {2, 0, 0}, {2, 2, 0}, {0, 2, 0}, {1, 1, 2}}], PlotTheme -> "Marketing"]Region[Pyramid[{{0, 0, 0}, {2, 0, 0}, {2, 2, 0}, {0, 2, 0}, {1, 1, 2}}], PlotTheme -> "Minimal"]Region[Pyramid[{{0, 0, 0}, {2, 0, 0}, {2, 2, 0}, {0, 2, 0}, {1, 1, 2}}], PlotTheme -> "Scientific"]Region[Pyramid[{{0, 0, 0}, {2, 0, 0}, {2, 2, 0}, {0, 2, 0}, {1, 1, 2}}], PlotTheme -> "Web"]Region[Pyramid[{{0, 0, 0}, {2, 0, 0}, {2, 2, 0}, {0, 2, 0}, {1, 1, 2}}], PlotTheme -> "Classic"]Properties (8)
mr = Region[DelaunayMesh[RandomReal[1, {20, 2}]]];RegionEmbeddingDimension[mr]RegionDimension[mr]mr = Region[Disk[]];{RegionMember[mr, {0, 0}], RegionMember[mr, {1, 1}]}mf = RegionMember[mr];
pts = RandomReal[{-1, 1}, {500, 2}];{Region[Point[Select[pts, mf]], BaseStyle -> Red], Region[Point[Select[pts, !mf[#]&]], BaseStyle -> StandardGray]}Measure is ArcLength for a 1D region, Area for a 2D region and Volume for a 3D region:
{mr1, mr2, mr3} = Region[DelaunayMesh[RandomReal[1, {20, #}]]]& /@ Range[3]RegionDimension /@ {mr1, mr2, mr3}RegionMeasure /@ {mr1, mr2, mr3}Compute the centroids of each:
{c1, c2, c3} = RegionCentroid /@ {mr1, mr2, mr3}mr = Region[DelaunayMesh[RandomReal[1, {10, 2}]]];{RegionDistance[mr, {0.5, 0.5}], RegionDistance[mr, {2, 2}]}df = RegionDistance[mr];
{Plot3D[df[{x, y}], {x, -0.5, 1.5}, {y, -0.5, 1.5}, MeshFunctions -> {#3&}, Mesh -> 5], ContourPlot[df[{x, y}], {x, -1.5, 2.5}, {y, -1.5, 2.5}, Contours -> {{0.5, Red}, {1, Green}, {1.5, Blue}}]}mr = Region[DelaunayMesh[RandomReal[1, {10, 2}]]];{SignedRegionDistance[mr, {0.5, 0.5}], SignedRegionDistance[mr, {2, 2}]}sdf = SignedRegionDistance[mr];
Plot3D[sdf[{x, y}], {x, -0.5, 1.5}, {y, -0.5, 1.5}, MeshFunctions -> {#3&}, Mesh -> {{0}}, MeshShading -> {Red, Green}]mr = Region[DelaunayMesh[RandomReal[1, {10, 2}]]];{RegionNearest[mr, {0.5, 0.5}], RegionNearest[mr, {2, 2}]}A Region is always bounded:
mr = Region[DelaunayMesh[RandomReal[1, {20, 2}]]];BoundedRegionQ[mr]rb = RegionBounds[mr]mr = Region[MeshRegion[{{0, 0}, {1, 0}, {1, 1}, {0, 1}}, Polygon[{1, 2, 3, 4}]]];Integrate[x y, {x, y}∈mr]Wrappers (5)
Use wrappers on a Region:
Region[Style[Disk[], Orange]]Region[Labeled[Style[Disk[], Red], "hello"]]Add interactive behavior with wrappers such as Tooltip:
Region[Tooltip[Style[Disk[], Red], "hello"]]Any object can be used in the tooltip:
Region[Tooltip[Style[Disk[], Red], Plot[Sin[x], {x, 0, 2Pi}]]]Use Button to trigger actions when clicking a Region:
Region[Button[Style[Disk[], Red], Speak["Disk"]]]Use PopupWindow to provide information drilldown:
Region[PopupWindow[Disk[], DateListPlot[FinancialData["IBM", "Jan. 1, 2004"]]]]Options (96)
AlignmentPoint (1)
Specify the position to be aligned in 3D Inset, using ![]() coordinates:
coordinates:
Table[Graphics[{Inset[Region[Triangle[{{0, 0}, {2, -1}, {2, 1}}], AlignmentPoint -> {a, 0}], {0, 0}]}, ImageSize -> 100, Axes -> True, Ticks -> None], {a, {0, 1 / 2, 1}}]Table[Graphics[{Inset[Region[Triangle[{{0, 0}, {2, -1}, {2, 1}}], AlignmentPoint -> {1 / 2, a}], {0, 0}]}, ImageSize -> 100, Axes -> True, Ticks -> None], {a, {0, 1 / 2, 1}}]AspectRatio (1)
Use numerical values for AspectRatio:
Table[Region[Triangle[{{0, 0}, {2, -1}, {2, 1}}], AspectRatio -> 1 / k], {k, 1, 3}]Axes (2)
AxesEdge (2)
Choose the bounding box edges automatically to draw the axes:
Region[Pyramid[], Boxed -> True, Axes -> True, AxesEdge -> Automatic]Choose the bounding box edges automatically to draw the axes:
Region[Pyramid[], Boxed -> True, Axes -> True, AxesEdge -> {{1, 1}, None, None}]AxesLabel (2)
AxesOrigin (2)
AxesStyle (2)
Specify the overall axes style, including the ticks and the tick labels:
Region[Triangle[{{0, 1}, {2, 0}, {2, 2}}], Axes -> True, AxesStyle -> Directive[Orange, 12]]Specify the style of each axis:
Region[Triangle[{{0, 1}, {2, 0}, {2, 2}}], Axes -> True, AxesStyle -> {Directive[Dashed, Red], Blue}]Background (1)
BaselinePosition (3)
Align the center of a graphic with the baseline of the text:
{x, Region[Triangle[{{0, 1}, {2, 0}, {2, 2}}], ImageSize -> 50, BaselinePosition -> Center], y}Specify the baseline of a graphic as a fraction of the height by using Scaled:
Table[{x, Region[Triangle[{{0, 1}, {2, 0}, {2, 2}}], ImageSize -> 50, BaselinePosition -> Scaled[b]]}, {b, {0, 0.5, 1}}]Use the axis of a graphic as the baseline:
{x, Region[Triangle[{{0, 1}, {2, 0}, {2, 2}}], ImageSize -> 50, BaselinePosition -> Axis], y}BaseStyle (2)
Boxed (2)
Draw the edges of the bounding box:
Region[Pyramid[{{0, 0, 0}, {2, 0, 0}, {2, 2, 0}, {0, 2, 0}, {1, 1, 2}}], Boxed -> True]Do not draw the edges of the bounding box:
Region[Pyramid[{{0, 0, 0}, {2, 0, 0}, {2, 2, 0}, {0, 2, 0}, {1, 1, 2}}], Boxed -> False]BoxRatios (2)
Specify the ratios between the bounding box edges:
Region[Pyramid[{{0, 0, 0}, {2, 0, 0}, {2, 2, 0}, {0, 2, 0}, {1, 1, 2}}], Boxed -> True, BoxRatios -> {1, 2, 3}]Use the actual coordinate values for the ratios:
Region[Pyramid[{{0, 0, 0}, {2, 0, 0}, {2, 2, 0}, {0, 2, 0}, {1, 1, 2}}], Boxed -> True, Axes -> True, BoxRatios -> Automatic]BoxStyle (1)
Epilog (1)
FaceGrids (4)
Put grids on every face of a 3D graphic:
Region[Pyramid[{{0, 0, 0}, {2, 0, 0}, {2, 2, 0}, {0, 2, 0}, {1, 1, 2}}], Axes -> True, Boxed -> True, FaceGrids -> All]Region[Pyramid[{{0, 0, 0}, {2, 0, 0}, {2, 2, 0}, {0, 2, 0}, {1, 1, 2}}], Axes -> True, Boxed -> True, FaceGrids -> {{0, 0, 1}, {0, 0, -1}}]Region[Pyramid[{{0, 0, 0}, {2, 0, 0}, {2, 2, 0}, {0, 2, 0}, {1, 1, 2}}], Axes -> True, Boxed -> True, FaceGrids -> {{0, -1, 0}}]On the ![]() plane, put grid lines on
plane, put grid lines on ![]() ,
, ![]() and
and ![]() :
:
Region[Pyramid[{{0, 0, 0}, {2, 0, 0}, {2, 2, 0}, {0, 2, 0}, {1, 1, 2}}], Axes -> True, Boxed -> True, FaceGrids -> {{{0, -1, 0}, {{1}, {2 / 3, 4 / 3}}}}]FaceGridsStyle (1)
Frame (2)
FrameLabel (2)
FrameStyle (2)
Specify the overall frame style:
Region[Triangle[{{0, 1}, {2, 0}, {2, 2}}], Frame -> True, FrameStyle -> Directive[Thick, Gray]]Specify the style of each frame edge:
Region[Triangle[{{0, 1}, {2, 0}, {2, 2}}], Frame -> True, FrameStyle -> {{Thick, Directive[Thick, Dashed]}, {Blue, Red}}]FrameTicks (3)
Region[Triangle[{{0, 1}, {2, 0}, {2, 2}}], Frame -> True, FrameTicks -> None]Tick mark labels on the bottom and left frame edges:
Region[Triangle[{{0, 1}, {2, 0}, {2, 2}}], Frame -> True, FrameTicks -> Automatic]Frame ticks on the bottom and right edges:
Region[Triangle[{{0, 1}, {2, 0}, {2, 2}}], Frame -> True, FrameTicks -> {{None, Automatic}, {Automatic, None}}]FrameTicksStyle (2)
Specify frame tick and frame tick label style:
Region[Triangle[{{0, 1}, {2, 0}, {2, 2}}], Frame -> True, FrameTicksStyle -> Directive[Orange, 12]]Specify frame tick style for each edge:
Region[Triangle[{{0, 1}, {2, 0}, {2, 2}}], Frame -> True, FrameTicksStyle -> {{Green, Blue}, {Red, Green}}]GridLines (3)
Put grids across a 2D graphic:
Region[Triangle[{{0, 1}, {2, 0}, {2, 2}}], GridLines -> Automatic]Draw grid lines at specific positions:
Region[Triangle[{{0, 1}, {2, 0}, {2, 2}}], Axes -> True, GridLines -> {{.5, 1.5}, {.5, 1.5}}]Specify the style of each grid:
Region[Triangle[{{0, 1}, {2, 0}, {2, 2}}], Axes -> True, GridLines -> {{{-1, Orange}, {-.5, Dotted}, {.5, Dotted}, {1, Orange}}, {-1, {-.5, Dotted}, {.5, Dotted}, 1}}]GridLinesStyle (1)
ImageMargins (3)
Allow no margins outside of ImageSize:
Framed[Region[Triangle[{{0, 1}, {2, 0}, {2, 2}}]]]Have 20-point margins on all sides:
Framed[Region[Triangle[{{0, 1}, {2, 0}, {2, 2}}], ImageMargins -> 20]]Draw grid lines at specific positions:
Framed[Region[Triangle[{{0, 1}, {2, 0}, {2, 2}}], ImageMargins -> {{5, 10}, {20, 30}}]]ImagePadding (4)
Leave no padding outside the plot range:
Region[Triangle[{{0, 1}, {2, 0}, {2, 2}}], ImagePadding -> None, Frame -> True, FrameLabel -> {x, y}]Leave enough padding for all objects and labels that are present:
Framed[Region[Triangle[{{0, 1}, {2, 0}, {2, 2}}], ImagePadding -> All, Frame -> True, FrameLabel -> {x, y}], FrameMargins -> 0]Specify the same padding for all sides in printer's points:
Framed[Region[Triangle[{{0, 1}, {2, 0}, {2, 2}}], ImagePadding -> 40, Frame -> True]]Specify the same padding for all sides in printer's points:
Framed[Region[Triangle[{{0, 1}, {2, 0}, {2, 2}}], ImagePadding -> {{40, 10}, {20, 5}}, Frame -> True]]ImageSize (3)
Use predefined symbolic sizes:
Table[Region[Triangle[{{0, 1}, {2, 0}, {2, 2}}], ImageSize -> s], {s, {Tiny, Small}}]{Region[Triangle[{{0, 1}, {2, 0}, {2, 2}}], ImageSize -> 100], Region[Triangle[{{0, 2}, {2, 0}, {2, 4}}], ImageSize -> 100]}Use an explicit image width and height:
{Region[Triangle[{{0, 1}, {2, 0}, {2, 2}}], ImageSize -> {100, 100}], Region[Triangle[{{0, 2}, {2, 0}, {2, 4}}], ImageSize -> {100, 100}]}LabelStyle (1)
Lighting (4)
Ambient light is uniformly applied to all the surfaces in the scene:
Region[Pyramid[{{0, 0, 0}, {2, 0, 0}, {2, 2, 0}, {0, 2, 0}, {1, 1, 2}}], Lighting -> {{"Ambient", Orange}}]Directional lights with different colors:
Table[Region[Pyramid[{{0, 0, 0}, {2, 0, 0}, {2, 2, 0}, {0, 2, 0}, {1, 1, 2}}], Lighting -> {{"Directional", c, {{1.5, 0, 2}, {0, 0, 0}}}}], {c, {Red, Yellow, Blue}}]Point lights with different colors:
Table[Region[Pyramid[{{0, 0, 0}, {2, 0, 0}, {2, 2, 0}, {0, 2, 0}, {1, 1, 2}}], Lighting -> {{"Point", c, {1.5, 0, 3}}}], {c, {Red, Yellow, Blue}}]Spotlights with different colors:
Table[Region[Pyramid[{{0, 0, 0}, {2, 0, 0}, {2, 2, 0}, {0, 2, 0}, {1, 1, 2}}], Lighting -> {{"Spot", c, {{1, 1, 2.5}, {1, 1, 2}}, Pi / 8}}], {c, {Red, Yellow, Blue}}]PlotLabel (2)
Display a label on the top of the graphic in TraditionalForm:
Region[Triangle[{{0, 1}, {2, 0}, {2, 2}}], PlotLabel -> x ^ 2 + y ^ 2 == 1]Use Style and other typesetting functions to modify how the label appears:
Region[Triangle[{{0, 1}, {2, 0}, {2, 2}}], PlotLabel -> Style[Framed[x ^ 2 + y ^ 2 == 1], 16, Red, Background -> Yellow]]PlotRange (3)
Region[Triangle[{{0, 1}, {2, 0}, {2, 2}}], Frame -> True, PlotRange -> All]Region[Triangle[{{-1, 0}, {1, -1}, {1, 1}}], PlotRange -> {{-1, 1}, {0, 1}}, Frame -> True]Force clipping at the PlotRange:
Region[Triangle[{{-1, 0}, {1, -1}, {1, 1}}], PlotRange -> {{-1, 1}, {0, 1}}, PlotRange -> {{-1, 1}, {0, 1}}, PlotRangeClipping -> True, Frame -> True]PlotRange->s is equivalent to PlotRange->{{-s,s},{-s,s}}:
Region[Triangle[{{-2, 0}, {2, -2}, {2, 2}}], Frame -> True, PlotRange -> 1]PlotRangeClipping (2)
Allow graphics objects to spread beyond PlotRange:
Region[Triangle[{{-2, 0}, {2, -2}, {2, 2}}], Frame -> True, PlotRange -> 1, PlotRangeClipping -> False]Clip all graphics objects at PlotRange:
Region[Triangle[{{-2, 0}, {2, -2}, {2, 2}}], Frame -> True, PlotRange -> 1, PlotRangeClipping -> True]PlotRangePadding (3)
Include 1 coordinate unit of padding on all sides:
Region[Triangle[{{0, 1}, {2, 0}, {2, 2}}], PlotRangePadding -> 1, Frame -> True]Include padding using Scaled coordinates:
Region[Triangle[{{0, 1}, {2, 0}, {2, 2}}], PlotRangePadding -> Scaled[0.1], Frame -> True]Specify different padding on each side:
Region[Triangle[{{0, 1}, {2, 0}, {2, 2}}], PlotRangePadding -> {{0.5, 1}, {0.3, 0.3}}, Frame -> True]PlotRegion (3)
The contents of a graphic use the whole region:
Region[Triangle[{{0, 1}, {2, 0}, {2, 2}}], Frame -> True, FrameTicks -> False, Background -> StandardBlue]Limit the contents of the graphic to the middle half of the region in each direction:
Region[Triangle[{{0, 1}, {2, 0}, {2, 2}}], Frame -> True, FrameTicks -> False, PlotRegion -> {{0.25, 0.75}, {0.25, 0.75}}, Background -> StandardBlue]ImagePadding can also be used to add padding around a graphic:
Region[Triangle[{{0, 1}, {2, 0}, {2, 2}}], Frame -> True, FrameTicks -> False, ImagePadding -> 30, Background -> StandardBlue]PlotTheme (3)
Base Themes (2)
Prolog (1)
Define a simple graphic to use as a background:
bg = Graphics[Polygon[{{0, 0}, {1, 0}, {1, 1}, {0, 1}}, VertexColors -> {Orange, Orange, White, White}], AspectRatio -> Full];Use it in multiple mesh regions:
Region[Triangle[{{0, 1}, {2, 0}, {2, 2}}], Prolog -> Inset[bg, Scaled[{0, 0}], Scaled[{0, 0}]]]Region[Line[{{0, 0}, {1, 0}, {2, 1 / 2}, {2, -1 / 2}, {1, 0}}], Prolog -> Inset[bg, Scaled[{0, 0}], Scaled[{0, 0}]]]RotateLabel (2)
Specify that vertical frame labels should be rotated:
Region[Triangle[{{0, 1}, {2, 0}, {2, 2}}], Frame -> True, FrameLabel -> {None, "y axis"}, RotateLabel -> True]Specify that vertical frame labels should not be rotated:
Region[Triangle[{{0, 1}, {2, 0}, {2, 2}}], Frame -> True, FrameLabel -> {None, "y axis"}, RotateLabel -> False]SphericalRegion (2)
Make a sequence of images be consistently sized, independent of orientation:
Table[Region[Pyramid[{{0, 0, 0}, {2, 0, 0}, {2, 2, 0}, {0, 2, 0}, {1, 1, 2}}], SphericalRegion -> True, ImageSize -> 80, ViewPoint -> 3.{ Sin[t], Cos[t], 1}], {t, 0, 4}]Without SphericalRegion, each image is made as big as possible:
Table[Region[Pyramid[{{0, 0, 0}, {2, 0, 0}, {2, 2, 0}, {0, 2, 0}, {1, 1, 2}}], ImageSize -> 80, ViewPoint -> 3.{ Sin[t], Cos[t], 1}], {t, 0, 4}]Ticks (3)
Draw the axes but no tick marks:
Region[Triangle[{{0, 1}, {2, 0}, {2, 2}}], Axes -> True, Ticks -> None]Place tick marks automatically:
Region[Triangle[{{0, 1}, {2, 0}, {2, 2}}], Axes -> True, Ticks -> Automatic]Draw tick marks at specific positions:
Region[Triangle[{{0, 1}, {2, 0}, {2, 2}}], Ticks -> {{1, 2, 3}, {1, 3}}, Axes -> True]TicksStyle (2)
Specify the styles of the ticks and tick labels:
Region[Triangle[{{0, 1}, {2, 0}, {2, 2}}], Ticks -> {{1, 2, 3}, {1, 3}}, Axes -> True, TicksStyle -> Directive[Red, Bold]]Specify the styles of ![]() and
and ![]() axis ticks separately:
axis ticks separately:
Region[Triangle[{{0, 1}, {2, 0}, {2, 2}}], Axes -> True, TicksStyle -> {Directive[Red, Bold], Directive[Blue, 12]}]ViewAngle (1)
ViewCenter (1)
ViewMatrix (1)
Orthographic view of a mesh region from the negative ![]() direction:
direction:
Region[Pyramid[{{0, 0, 0}, {2, 0, 0}, {2, 2, 0}, {0, 2, 0}, {1, 1, 2}}], ViewMatrix -> {TransformationMatrix[RescalingTransform[{{-1, 1}, {-1, 1}, {-1, 1}}]], {{1, 0, 0, 0}, {0, 1, 0, 0}, {0, 0, -1, 0}, {0, 0, 0, 1}}}]ViewPoint (3)
Specify the view point using the special scaled coordinates:
Region[Pyramid[{{0, 0, 0}, {2, 0, 0}, {2, 2, 0}, {0, 2, 0}, {1, 1, 2}}], ViewPoint -> {Pi, Pi / 2, 2}]{Region[Pyramid[{{0, 0, 0}, {2, 0, 0}, {2, 2, 0}, {0, 2, 0}, {1, 1, 2}}], ViewPoint -> Front],
Region[Pyramid[{{0, 0, 0}, {2, 0, 0}, {2, 2, 0}, {0, 2, 0}, {1, 1, 2}}], ViewPoint -> Top]}{Region[Pyramid[{{0, 0, 0}, {2, 0, 0}, {2, 2, 0}, {0, 2, 0}, {1, 1, 2}}], ViewPoint -> {0, -Infinity, 0}],
Region[Pyramid[{{0, 0, 0}, {2, 0, 0}, {2, 2, 0}, {0, 2, 0}, {1, 1, 2}}], ViewPoint -> {0, 0, Infinity}]}ViewRange (2)
By default, the range is sufficient to include all the objects:
Region[Pyramid[{{0, 0, 0}, {2, 0, 0}, {2, 2, 0}, {0, 2, 0}, {1, 1, 2}}], ViewPoint -> {1, 0, 1.5}, SphericalRegion -> True]Specify the minimum and maximum distances from the camera to be included:
Region[Pyramid[{{0, 0, 0}, {2, 0, 0}, {2, 2, 0}, {0, 2, 0}, {1, 1, 2}}], ViewPoint -> {1, 0, 1.5}, ViewRange -> {3.5, 7.2}, SphericalRegion -> True]ViewVector (1)
ViewVertical (2)
Use the ![]() axis direction as the vertical direction in the final image:
axis direction as the vertical direction in the final image:
Region[Pyramid[{{0, 0, 0}, {2, 0, 0}, {2, 2, 0}, {0, 2, 0}, {1, 1, 2}}], ViewVertical -> {1, 0, 0}]Various views of vertical directions:
Table[Region[Pyramid[{{0, 0, 0}, {2, 0, 0}, {2, 2, 0}, {0, 2, 0}, {1, 1, 2}}], ViewVertical -> v], {v, {{1, 0, 1}, {.5, 0, 1}, {0, -.5, 1}, {0, -1, 1}}}]Properties & Relations (2)
Region can have any geometric dimension:
point = Region[Point[{{0, 0}}]];
line = Region[Line[{{0, 0}, {1, 1}}]];
polygon = Region[Polygon[{{0, 0}, {1, 0}, {1, 1}}]];
polytope = Region[Tetrahedron[{{0, 0, 0}, {1, 0, 0}, {0, 1, 0}, {0, 0, 1}}]];RegionDimension /@ {point, line, polygon, polytope}RegionQ can be used to test whether a region is a Region:
ℛ = Region[Cone[]]RegionQ[ℛ]Text
Wolfram Research (2017), Region, Wolfram Language function, https://reference.wolfram.com/language/ref/Region.html (updated 2017).
CMS
Wolfram Language. 2017. "Region." Wolfram Language & System Documentation Center. Wolfram Research. Last Modified 2017. https://reference.wolfram.com/language/ref/Region.html.
APA
Wolfram Language. (2017). Region. Wolfram Language & System Documentation Center. Retrieved from https://reference.wolfram.com/language/ref/Region.html