


MeshRegion
MeshRegion[{p1,p2,…},{mcell1[{i1,…}],mcell2[{j1,…}],…}]
yields a mesh with cells mcellj, where coordinates given as integer i are taken to be pi.
MeshRegion[…,{…,wi[mcelli[…]],…}]
yields a mesh with cell properties defined by the symbolic wrapper wi.
MeshRegion[mreg,opts]
yields a mesh from a mesh region mreg with options opts.
Details and Options
- MeshRegion is also known as a simplicial complex or cell complex.
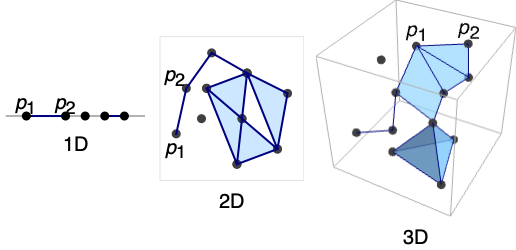
- MeshRegion can represent a piecewise linear region of any geometric dimension embedded in dimension 1, 2, or 3.
- MeshRegion[…] displays in a notebook as a plot of a mesh region.
- MeshRegion is typically created using functions such as DelaunayMesh, DiscretizeGraphics, and DiscretizeRegion.
- The region represented by MeshRegion consists of the disjoint union of mesh cells.
- MeshRegion has an embedding dimension that is equal to the length of each point pi and can be found using RegionEmbeddingDimension.
- Each cell has a geometric dimension and can be found using RegionDimension.
- Possible mesh cells mcelli and their geometric dimensions:
-
Point[i] 0 point Line[{i1,i2,…}] 1 line segments {i1,i2}, {i2,i3}, … Triangle[{i1,i2,i3}] 2 filled triangle Polygon[{i1,i2,…}] 2 filled polygon Polyhedron[{{ii,i2,…},…}] 3 filled polyhedron Tetrahedron[{i1,…,i4}] 3 filled tetrahedron Hexahedron[{i1,…,i8}] 3 filled hexahedron Pyramid[{i1,…,i5}] 3 filled pyramid Prism[{i1,…,i6}] 3 filled prism Simplex[{i1,…,ik}] 0, 1, 2, 3 filled simplex - Tetrahedron, Hexahedron, Pyramid, and Prism can only be used with 3D coordinates.
- Point, Line, Triangle, Polygon, Polyhedron, Tetrahedron, Hexahedron, Pyramid, Prism, and Simplex all have multi-cell specifications as well.
- The following special wrappers wi can be used for cells:
-
Labeled[cell,…] display the cell with labeling Style[cell,…] show the cell with the specified style Annotation[cell,namevalue] associate the annotation name->value with cell - Each cell in a MeshRegion is given a unique MeshCellIndex of the form {d,i}, where d is the geometric dimension and i is the index.
- For purposes of selecting cells of a MeshRegion, the following cell specifications may be used:
-
{d,i} cell with index i of dimension d {d,ispec} cells with index specification ispec of dimension d {dspec,…} cells of dimensions given by dspec h[{i1,…}] explicit cell with head h and vertex indices i1, … {c1,c2,…} list of explicit cells ci - The index specification ispec can have the following form:
-
i cell index i {i1,i2,…} cells with indices ik All all cells patt cells with indices matching the pattern patt - The dimension specification dspec can have the following form:
-
d explicit dimension d All all dimensions from 0 to geometric dimension of region patt dimensions matching the pattern patt - MeshRegion is always converted to an optimized representation and treated as raw by functions like AtomQ and for purposes of pattern matching.
- MeshRegion has the same options as Graphics for embedding dimension 2 and the same options as Graphics3D for embedding dimension 3 with the following additions and changes:
-
MeshCellLabel Automatic labels and placement for cells MeshCellShapeFunction Automatic shape functions for cells MeshCellStyle Automatic styles for cells MeshCellHighlight {} list of highlighted cells MeshCellMarker 0 integer markers for cells PlotTheme $PlotTheme overall theme for the mesh - Possible settings for PlotTheme include common base themes, font features themes, and size features themes.
- Mesh feature themes affect the plots of mesh cells. Themes include:
-

"Points" 0D cells 
"Lines" 1D cells, wireframe 
"Polygons" 2D cells - Rendering feature themes affect the rendering of meshes. Themes include:
-

"SampledPoints" sampled points from mesh cells 
"SphereAndTube" points as spheres and lines as tubes 
"SmoothShading" smooth shading 
"FaceNormals" normal for each 2D cell 
"LargeMesh" optimized for large number of cells - Style and other specifications for cells are effectively applied in the order MeshCellStyle, Style, and other wrappers, with later specifications overriding earlier ones.
- Label style and other specifications for cell labels are effectively applied in the order MeshCellLabel and Labeled, with later specifications overriding earlier ones.
- MeshRegion can be used with functions such as RegionMember, RegionDistance, RegionMeasure, and NIntegrate.
Examples
open all close allBasic Examples (6)
A 1D (curve) mesh region in 1D:
MeshRegion[{{0}, {1}, {2}, {3}}, {Line[{1, 2}], Line[{3, 4}]}]Label each point with its index:
HighlightMesh[%, Labeled[0, "Index"]]A 1D (curve) mesh region in 2D:
MeshRegion[{{0, 0}, {1, 0}, {2, 1 / 2}, {2, -1 / 2}}, {Line[{1, 2}], Line[{2, 3}], Line[{3, 4}], Line[{4, 2}]}]Label each point with its index:
HighlightMesh[%, Labeled[0, "Index"]]A 2D (surface) mesh region in 3D with each point labeled by its index:
ℛ = MeshRegion[{{0, 0, 0}, {0, 0, 1}, {0, -1, 0}, {1, 0, 0}, {0, 1, 0}}, {Triangle[{1, 2, 3}], Triangle[{1, 2, 4}], Triangle[{1, 2, 5}]}];HighlightMesh[ℛ, Labeled[0, "Index"]]A 3D (volume) mesh region in 3D with points labeled by its index:
ℛ = MeshRegion[{{0, 0, 0}, {2, 0, 0}, {2, 2, 0}, {0, 2, 0}, {1, 1, 2}}, {Tetrahedron[{1, 2, 3, 5}], Tetrahedron[{1, 3, 4, 5}]}];HighlightMesh[ℛ, Labeled[0, "Index"]]A mesh region containing cells of mixed dimensions:
ℛ = MeshRegion[{{0, 0, 0}, {1, 0, 0}, {2, 0, 0}, {3, 0, -1 / 2}, {3, 0, 1 / 2}, {4, -1 / 2, 0}, {4, 1 / 2, 0}}, {Point[1], Line[{2, 3}], Triangle[{3, 4, 5}], Tetrahedron[{4, 6, 5, 7}]}];HighlightMesh[ℛ, Labeled[0, "Index"]]A volume mesh region in 3D from DelaunayMesh:
DelaunayMesh[RandomReal[1, {50, 3}]]RegionMeasure[%]Scope (41)
Regions in 1D (3)
A strictly 0D MeshRegion is a point set:
MeshRegion[{{0}, {1}, {2}}, Point[{{1}, {2}, {3}}]]Label the points with HighlightMesh:
HighlightMesh[%, Labeled[0, "Index"]]A strictly 1D MeshRegion is a collection of line segments:
MeshRegion[{{0}, {1}, {2}}, Line[{1, 2, 3}]]Label the segments with HighlightMesh:
HighlightMesh[%, Labeled[1, "Index"]]A MeshRegion can combine elements of different dimensions:
MeshRegion[{{0}, {1}, {2}}, {Point[{1}], Line[{2, 3}]}]Separate them with DimensionalMeshComponents:
DimensionalMeshComponents[%]Regions in 2D (4)
A strictly 0D MeshRegion is a point set:
MeshRegion[Tuples[{0, 1, 2}, 2], Point[{List /@ Range[9]}]]Label the points with HighlightMesh:
HighlightMesh[%, Labeled[0, "Index"]]A strictly 1D MeshRegion is a collection of line segments:
MeshRegion[{{0, 0}, {1, 0}, {0, 1}, {1, 1}, {2, 1}}, Line[{{1, 2, 3, 1}, {4, 5}}]]Label the segments with HighlightMesh:
HighlightMesh[%, Labeled[1, "Index"]]A strictly 2D MeshRegion is a collection of polygonal faces:
MeshRegion[{{0, 0}, {1, 0}, {0, 1}, {1, 1}, {2, 1}, {2, 0}}, Polygon[{{1, 2, 3}, {4, 5, 6}}]]Label the faces with HighlightMesh:
HighlightMesh[%, Labeled[2, "Index"]]A MeshRegion can combine elements of different dimensions:
ℛ = MeshRegion[{{0, 0}, {1, 0}, {2, 0}, {3, -1 / 2}, {3, 1 / 2}}, {Point[{1}], Line[{2, 3}], Triangle[{3, 4, 5}]}]Separate them with DimensionalMeshComponents:
DimensionalMeshComponents[ℛ]Regions in 3D (5)
A strictly 0D MeshRegion is a point set:
MeshRegion[Tuples[{0, 1}, 3], Point[{List /@ Range[8]}]]Label the points with HighlightMesh:
HighlightMesh[%, Labeled[0, "Index"]]A strictly 1D MeshRegion is a collection of line segments:
MeshRegion[{{0, 0, 0}, {1, 0, 0}, {0, 1, 0}, {0, 0, 1}}, Line[Union[Sort /@ Permutations[Range[4], {2}]]]]Label the segments with HighlightMesh:
HighlightMesh[%, Labeled[1, "Index"]]A strictly 2D MeshRegion is a collection of polygonal faces:
MeshRegion[{{0, 0, 0}, {1, 0, 0}, {0, 1, 0}, {0, 0, 1}}, Polygon[{{1, 3, 2}, {4, 2, 3}, {3, 1, 4}}]]Label the faces with HighlightMesh:
HighlightMesh[%, Labeled[2, "Index"]]A strictly 3D MeshRegion is a collection of polyhedral volumes:
MeshRegion[{{0, 0, 0}, {1, 0, 0}, {0, 1, 0}, {0, 0, 1}}, Tetrahedron[{1, 2, 3, 4}]]Polyhedral volume cells include Tetrahedron, Prism, Pyramid, and Hexahedron:
pts = {{0, 0, 0}, {1, 0, 0}, {1, 1, 0}, {0, 1, 0}, {0, 0, 1}, {1, 0, 1}, {1, 1, 1}, {0, 1, 1}, {0.5, 0.5, 1.5}, {1.5, 0, 0}, {1.5, 1, 0}, {1, -0.5, 0}};MeshRegion[pts, {Hexahedron[{1, 2, 3, 4, 5, 6, 7, 8}], Pyramid[{5, 6, 7, 8, 9}], Prism[{2, 10, 6, 3, 11, 7}], Tetrahedron[{2, 10, 6, 12}]}]A MeshRegion can combine elements of different dimensions:
MeshRegion[{{0, 0, 0}, {1, 0, 0}, {2, 0, 0}, {3, 0, 1 / 2}, {3, 0, -1 / 2}, {4, 1 / 2, 0}, {4, -1 / 2, 0}}, {Simplex[{1}], Simplex[{2, 3}], Simplex[{3, 4, 5}], Simplex[{4, 5, 6, 7}]}]Presentation (11)
MeshCellLabel can be used to label the parts of a MeshRegion:
MeshRegion[{{0, 0}, {1, 0}, {0, 1}}, Triangle[{1, 2, 3}], MeshCellLabel -> {0 -> "Index"}]The labels do not have to be strings:
MeshRegion[{{0, 0}, {1, 0}, {0, 1}}, Triangle[{1, 2, 3}], MeshCellLabel -> {{1, 1} -> Red, {1, 2} -> Green, {1, 3} -> Blue}]Labeled can be used as a wrapper to label cells when constructing a MeshRegion:
MeshRegion[{{0, 0}, {1, 0}, {1, 1}, {0, 1}}, {Labeled[Triangle[{1, 2, 3}], "a"], Labeled[Triangle[{3, 4, 1}], "b"]}]The labels do not need to be strings:
MeshRegion[{{0, 0}, {1, 0}, {1, 1}, {0, 1}}, {Labeled[Triangle[{1, 2, 3}], Sqrt[x ^ 2 + y ^ 2]], Labeled[Triangle[{3, 4, 1}], Red]}]MeshCellMarker can be used to mark parts of a MeshRegion:
MeshRegion[{{0, 0}, {1, 0}, {0, 1}}, Triangle[{1, 2, 3}], MeshCellMarker -> {{0, 1} -> 1, {0, 2} -> 2, {0, 3} -> 3}, MeshCellLabel -> {0 -> "Marker"}]MeshCellStyle can be used to set the Style of components of a MeshRegion:
MeshRegion[{{0, 0}, {1, 0}, {0, 1}}, Triangle[{1, 2, 3}], MeshCellStyle -> {{1, 1} -> {Thick, StandardGray}, {1, 2} -> {Thick, Dashed, Green}, {1, 3} -> {Thickness[0.02], DotDashed, Blue}, {2, 1} -> LightRed}]Style can be used as a wrapper to style cells when constructing a MeshRegion:
MeshRegion[{{0, 0}, {1, 0}, {1, 1}, {0, 1}}, {Style[Polygon[{1, 2, 3}], Red], Style[Polygon[{3, 4, 1}], {Green, EdgeForm[Directive[Thick, StandardBlue]]}]}]MeshRegion[[image], PlotTheme -> "Points"]Use a theme to draw 1D cells or a wireframe:
MeshRegion[[image], PlotTheme -> "Lines"]MeshRegion[[image], PlotTheme -> "Polygons"]Use a theme to draw sampled points from mesh cells:
MeshRegion[[image], PlotTheme -> "SampledPoints"]Use a theme to smooth shading:
MeshRegion[[image], PlotTheme -> "SmoothShading"]Use a theme to draw normals for each 2D cell:
MeshRegion[[image], PlotTheme -> "FaceNormals"]Region Properties (8)
mr = DelaunayMesh[RandomReal[1, {20, 2}]];RegionEmbeddingDimension[mr]RegionDimension[mr]mr = DiscretizeRegion[Disk[]];{RegionMember[mr, {0, 0}], RegionMember[mr, {1, 1}]}mf = RegionMember[mr];
pts = RandomReal[{-1, 1}, {500, 2}];
Show[mr, Graphics[{Red, Point[Select[pts, mf]], StandardGray, Point[Select[pts, !mf[#]&]]}]]Measure is ArcLength for a 1D mesh, Area for a 2D mesh, and Volume for a 3D mesh:
{mr1, mr2, mr3} = DelaunayMesh[RandomReal[1, {20, #}]]& /@ Range[3]RegionDimension /@ {mr1, mr2, mr3}RegionMeasure /@ {mr1, mr2, mr3}Compute and visualize the centroids of each:
{c1, c2, c3} = RegionCentroid /@ {mr1, mr2, mr3}{Show[mr1, Graphics[{Red, Point[Join[c1, {0}]]}]], Show[mr2, Graphics[{Red, Point[c2]}]], Show[HighlightMesh[mr3, Style[{2, All}, Opacity[0.2]]], Graphics3D[{Red, PointSize[Large], Point[c3]}]]}mr = DelaunayMesh[RandomReal[1, {10, 2}]];{RegionDistance[mr, {0.5, 0.5}], RegionDistance[mr, {2, 2}]}df = RegionDistance[mr];
{Plot3D[df[{x, y}], {x, -0.5, 1.5}, {y, -0.5, 1.5}, MeshFunctions -> {#3&}, Mesh -> 5], ContourPlot[df[{x, y}], {x, -1.5, 2.5}, {y, -1.5, 2.5}, Contours -> {{0.5, Red}, {1, Green}, {1.5, Blue}}]}mr = DelaunayMesh[RandomReal[1, {10, 2}]];{SignedRegionDistance[mr, {0.5, 0.5}], SignedRegionDistance[mr, {2, 2}]}sdf = SignedRegionDistance[mr];
Plot3D[sdf[{x, y}], {x, -0.5, 1.5}, {y, -0.5, 1.5}, MeshFunctions -> {#3&}, Mesh -> {{0}}, MeshShading -> {Red, Green}]mr = DelaunayMesh[RandomReal[1, {10, 2}]];{RegionNearest[mr, {0.5, 0.5}], RegionNearest[mr, {2, 2}]}pts = Table[{0.5, 0.5} + {Cos[k 2π / 16], Sin[k 2π / 16]}, {k, 0., 15}];
nst = RegionNearest[mr][pts];Legended[Show[mr, Graphics[{{Thin, Gray, Line[Transpose[{pts, nst}]]}, {Red, Point[pts]}, {Blue, Point[nst]}}]], PointLegend[{Red, Blue}, {"start", "nearest"}]]A MeshRegion is always bounded:
mr = DelaunayMesh[RandomReal[1, {20, 2}]];BoundedRegionQ[mr]rb = RegionBounds[mr]Show[Graphics[{EdgeForm[{Dashed, Red}], Opacity[0.1, Yellow], Cuboid@@Transpose[rb]}], mr]Integrate over a MeshRegion:
mr = MeshRegion[{{0, 0}, {1, 0}, {1, 1}, {0, 1}}, Polygon[{1, 2, 3, 4}]];Integrate[x y, {x, y}∈mr]Mesh Properties (10)
MeshCellCount returns the number of cells matching a given dimension or cell specification:
mr = DelaunayMesh[RandomReal[1, {20, 2}]]MeshCellCount[mr, 1]When no cell specification is given, the value for each dimension is returned:
MeshCellCount[mr]MeshCells returns the cells in the mesh matching a given dimension or cell specification:
mr = DelaunayMesh[RandomReal[1, {8, 2}]]MeshCells[mr, 1]Individual cell indices or sets of cell indices can be used:
MeshCells[mr, {{1, 1}, {2, 1}}]MeshCellIndex gets the index of a cell or set of cells in a mesh:
mr = MeshRegion[{{0, 0}, {1, 0}, {0, 1}}, Polygon[{1, 2, 3}]]MeshCellIndex[mr, {Polygon[{1, 2, 3}], Line[{2, 3}], Point[{3}]}]MeshCoordinates gets the coordinates of the mesh:
mr = DelaunayMesh[RandomReal[1, {8, 2}]]MeshCoordinates[mr]This list of coordinates is what the MeshCells refer to:
MeshCells[mr, {2, 1}]MeshPrimitives returns the primitives that make up the mesh:
mr = DelaunayMesh[RandomReal[1, {8, 2}]]MeshPrimitives[mr, 0]Individual cell indices or sets of cell indices can be used:
MeshPrimitives[mr, {2, {1, 2, 3}}]DimensionalMeshComponents separates out components of a mesh with different dimensions:
mr = MeshRegion[{{0, 0}, {1, 0}, {2, 0}, {3, -1 / 2}, {3, 1 / 2}}, {Point[{1}], Line[{2, 3}], Polygon[{3, 4, 5}]}]DimensionalMeshComponents[mr]ConnectedMeshComponents separates out components of a mesh based on connectivity:
mr = DiscretizeRegion[RegionUnion[Disk[{0, 0}, 1], Disk[{3, 0}, 1]]]ConnectedMeshComponents[mr]MeshCellMeasure can be used to get the measures of a set of cells in a mesh:
mr = DelaunayMesh[RandomReal[1, {20, 2}]]AnnotationValue[{mr, {2, {1, 2, 3, 4, 5}}}, MeshCellMeasure]The appropriate measure is used for each dimension:
AnnotationValue[{mr, {1, {8, 9, 10}}}, MeshCellMeasure]MeshCellCentroid can be used to get the centroids of a set of cells in a mesh:
mr = DelaunayMesh[RandomReal[1, {20, 2}]]c = AnnotationValue[{mr, {2, {1, 2, 3, 4, 5}}}, MeshCellCentroid]Show[mr, Graphics[{Red, Point[c]}]]MeshCellQuality can be used to get the quality of a set of cells in a mesh:
mr = DelaunayMesh[RandomReal[1, {20, 2}]]AnnotationValue[{mr, 2}, MeshCellQuality]Options (114)
AlignmentPoint (1)
Specify the position to be aligned in 3D Inset, using ![]() coordinates:
coordinates:
Table[Graphics[{Inset[MeshRegion[{{0, 0}, {2, -1}, {2, 1}}, {Triangle[{1, 2, 3}]}, ImageSize -> 50, AlignmentPoint -> {a, 0}], {0, 0}]}, ImageSize -> 100, Axes -> True, Ticks -> None], {a, {0, 1 / 2, 1}}]Table[Graphics[{Inset[MeshRegion[{{0, 0}, {2, -1}, {2, 1}}, {Triangle[{1, 2, 3}]}, ImageSize -> 50, AlignmentPoint -> {1 / 2, a}], {0, 0}]}, ImageSize -> 100, Axes -> True, Ticks -> None], {a, {0, 1 / 2, 1}}]AspectRatio (1)
Use numerical values for AspectRatio:
Table[MeshRegion[{{0, 0}, {2, -1}, {2, 1}}, {Triangle[{1, 2, 3}]}, AspectRatio -> 1 / k], {k, 1, 3}]Axes (2)
AxesEdge (2)
Choose the bounding box edges automatically to draw the axes:
MeshRegion[{{0, 0, 0}, {2, 0, 0}, {2, 2, 0}, {0, 2, 0}, {1, 1, 2}}, Pyramid[{1, 2, 3, 4, 5}], Boxed -> True, Axes -> True, AxesEdge -> Automatic]Choose the bounding box edges automatically to draw the axes:
MeshRegion[{{0, 0, 0}, {2, 0, 0}, {2, 2, 0}, {0, 2, 0}, {1, 1, 2}}, Pyramid[{1, 2, 3, 4, 5}], Boxed -> True, Axes -> True, AxesEdge -> {{1, 1}, None, None}]AxesLabel (2)
AxesOrigin (2)
Determine where the axes cross automatically:
MeshRegion[{{0, 0}, {2, -1}, {2, 1}}, Triangle[{1, 2, 3}], Axes -> True, AxesOrigin -> Automatic]Specify the axes' origin explicitly:
MeshRegion[{{0, 0}, {2, -1}, {2, 1}}, Triangle[{1, 2, 3}], Axes -> True, AxesOrigin -> {0, -1}]AxesStyle (2)
Specify the overall axes style, including the ticks and the tick labels:
MeshRegion[{{0, 1}, {2, 0}, {2, 2}}, Triangle[{1, 2, 3}], Axes -> True, AxesStyle -> Directive[Orange, 12]]Specify the style of each axis:
MeshRegion[{{0, 1}, {2, 0}, {2, 2}}, Triangle[{1, 2, 3}], Axes -> True, AxesStyle -> {Directive[Dashed, Red], Blue}]Background (1)
BaselinePosition (3)
Align the center of a graphic with the baseline of the text:
{x, MeshRegion[{{0, 1}, {2, 0}, {2, 2}}, Triangle[{1, 2, 3}], ImageSize -> 50, BaselinePosition -> Center], y}Specify the baseline of a graphic as a fraction of the height by using Scaled:
Table[{x, MeshRegion[{{0, 1}, {2, 0}, {2, 2}}, Triangle[{1, 2, 3}], ImageSize -> 50, BaselinePosition -> Scaled[b]]}, {b, {0, 0.5, 1}}]Use the axis of a graphic as the baseline:
{x, MeshRegion[{{0, 1}, {2, 0}, {2, 2}}, Triangle[{1, 2, 3}], ImageSize -> 50, BaselinePosition -> Axis], y}BaseStyle (2)
Boxed (2)
Draw the edges of the bounding box:
MeshRegion[{{0, 0, 0}, {2, 0, 0}, {2, 2, 0}, {0, 2, 0}, {1, 1, 2}}, Pyramid[{1, 2, 3, 4, 5}], Boxed -> True]Do not draw the edges of the bounding box:
MeshRegion[{{0, 0, 0}, {2, 0, 0}, {2, 2, 0}, {0, 2, 0}, {1, 1, 2}}, Pyramid[{1, 2, 3, 4, 5}], Boxed -> False]BoxRatios (2)
Specify the ratios between the bounding box edges:
MeshRegion[{{0, 0, 0}, {2, 0, 0}, {2, 2, 0}, {0, 2, 0}, {1, 1, 2}}, Pyramid[{1, 2, 3, 4, 5}], Boxed -> True, BoxRatios -> {1, 2, 3}]Use the actual coordinate values for the ratios:
MeshRegion[{{0, 0, 0}, {2, 0, 0}, {2, 2, 0}, {0, 2, 0}, {1, 1, 2}}, Pyramid[{1, 2, 3, 4, 5}], Boxed -> True, Axes -> True, BoxRatios -> Automatic]BoxStyle (1)
Epilog (1)
FaceGrids (4)
Put grids on every face of a 3D graphic:
MeshRegion[{{0, 0, 0}, {2, 0, 0}, {2, 2, 0}, {0, 2, 0}, {1, 1, 2}}, Pyramid[{1, 2, 3, 4, 5}], Axes -> True, Boxed -> True, FaceGrids -> All]MeshRegion[{{0, 0, 0}, {2, 0, 0}, {2, 2, 0}, {0, 2, 0}, {1, 1, 2}}, Pyramid[{1, 2, 3, 4, 5}], Axes -> True, Boxed -> True, FaceGrids -> {{0, 0, 1}, {0, 0, -1}}]MeshRegion[{{0, 0, 0}, {2, 0, 0}, {2, 2, 0}, {0, 2, 0}, {1, 1, 2}}, Pyramid[{1, 2, 3, 4, 5}], Axes -> True, Boxed -> True, FaceGrids -> {{0, -1, 0}}]On the ![]() plane, put grid lines on
plane, put grid lines on ![]() ,
, ![]() , and
, and ![]() :
:
MeshRegion[{{0, 0, 0}, {2, 0, 0}, {2, 2, 0}, {0, 2, 0}, {1, 1, 2}}, Pyramid[{1, 2, 3, 4, 5}], Axes -> True, Boxed -> True, FaceGrids -> {{{0, -1, 0}, {{1}, {2 / 3, 4 / 3}}}}]FaceGridsStyle (1)
Frame (2)
Draw a frame around the whole graphic:
MeshRegion[{{0, 1}, {2, 0}, {2, 2}}, Triangle[{1, 2, 3}], Frame -> True]Draw a frame on the left and the right edges:
MeshRegion[{{0, 1}, {2, 0}, {2, 2}}, Triangle[{1, 2, 3}], Frame -> {{True, True}, {False, False}}]FrameLabel (2)
Specify frame labels for the bottom and the left edges:
MeshRegion[{{0, 1}, {2, 0}, {2, 2}}, Triangle[{1, 2, 3}], Frame -> True, FrameLabel -> {x, y}]MeshRegion[{{0, 1}, {2, 0}, {2, 2}}, Triangle[{1, 2, 3}], Frame -> True, FrameLabel -> {{a, b}, {c, d}}]FrameStyle (2)
Specify the overall frame style:
MeshRegion[{{0, 1}, {2, 0}, {2, 2}}, Triangle[{1, 2, 3}], Frame -> True, FrameStyle -> Directive[Thick, Gray]]Specify the style of each frame edge:
MeshRegion[{{0, 1}, {2, 0}, {2, 2}}, Triangle[{1, 2, 3}], Frame -> True, FrameStyle -> {{Thick, Directive[Thick, Dashed]}, {Blue, Red}}]FrameTicks (3)
MeshRegion[{{0, 1}, {2, 0}, {2, 2}}, Triangle[{1, 2, 3}], Frame -> True, FrameTicks -> None]Tick mark labels on the bottom and the left frame edges:
MeshRegion[{{0, 1}, {2, 0}, {2, 2}}, Triangle[{1, 2, 3}], Frame -> True, FrameTicks -> Automatic]Frame ticks on the bottom and the right edges:
MeshRegion[{{0, 1}, {2, 0}, {2, 2}}, Triangle[{1, 2, 3}], Frame -> True, FrameTicks -> {{None, Automatic}, {Automatic, None}}]FrameTicksStyle (2)
Specify frame tick and frame tick label style:
MeshRegion[{{0, 1}, {2, 0}, {2, 2}}, Triangle[{1, 2, 3}], Frame -> True, FrameTicksStyle -> Directive[Orange, 12]]Specify frame tick style for each edge:
MeshRegion[{{0, 1}, {2, 0}, {2, 2}}, Triangle[{1, 2, 3}], Frame -> True, FrameTicksStyle -> {{Green, Blue}, {Red, Green}}]GridLines (3)
Put grids across a 2D graphic:
MeshRegion[{{0, 1}, {2, 0}, {2, 2}}, Triangle[{1, 2, 3}], GridLines -> Automatic]Draw grid lines at specific positions:
MeshRegion[{{0, 1}, {2, 0}, {2, 2}}, Triangle[{1, 2, 3}], Axes -> True, GridLines -> {{.5, 1.5}, {.5, 1.5}}]Specify the style of each grid:
MeshRegion[{{-1, 0}, {1, -1}, {1, 1}}, Triangle[{1, 2, 3}], Axes -> True, GridLines -> {{{-1, Orange}, {-.5, Dotted}, {.5, Dotted}, {1, Orange}}, {-1, {-.5, Dotted}, {.5, Dotted}, 1}}]GridLinesStyle (1)
ImageMargins (3)
Allow no margins outside of ImageSize:
Framed[MeshRegion[{{0, 1}, {2, 0}, {2, 2}}, Triangle[{1, 2, 3}]]]Have 20-point margins on all sides:
Framed[MeshRegion[{{0, 1}, {2, 0}, {2, 2}}, Triangle[{1, 2, 3}], ImageMargins -> 20]]Draw grid lines at specific positions:
Framed[MeshRegion[{{0, 1}, {2, 0}, {2, 2}}, Triangle[{1, 2, 3}], ImageMargins -> {{5, 10}, {20, 30}}]]ImagePadding (4)
Leave no padding outside the plot range:
MeshRegion[{{0, 1}, {2, 0}, {2, 2}}, Triangle[{1, 2, 3}], ImagePadding -> None, Frame -> True, FrameLabel -> {x, y}]Leave enough padding for all objects and labels that are present:
Framed[MeshRegion[{{0, 1}, {2, 0}, {2, 2}}, Triangle[{1, 2, 3}], ImagePadding -> All, Frame -> True, FrameLabel -> {x, y}], FrameMargins -> 0]Specify the same padding for all sides in printer's points:
Framed[MeshRegion[{{0, 1}, {2, 0}, {2, 2}}, Triangle[{1, 2, 3}], ImagePadding -> 40, Frame -> True]]Specify the same padding for all sides in printer's points:
Framed[MeshRegion[{{0, 1}, {2, 0}, {2, 2}}, Triangle[{1, 2, 3}], ImagePadding -> {{40, 10}, {20, 5}}, Frame -> True]]ImageSize (3)
Use predefined symbolic sizes:
Table[MeshRegion[{{0, 1}, {2, 0}, {2, 2}}, Triangle[{1, 2, 3}], ImageSize -> s], {s, {Tiny, Small}}]{MeshRegion[{{0, 1}, {2, 0}, {2, 2}}, Triangle[{1, 2, 3}], ImageSize -> 100], MeshRegion[{{0, 2}, {2, 0}, {2, 4}}, Triangle[{1, 2, 3}], ImageSize -> 100]}Use an explicit image width and height:
{MeshRegion[{{0, 1}, {2, 0}, {2, 2}}, Triangle[{1, 2, 3}], ImageSize -> {100, 100}], MeshRegion[{{0, 2}, {2, 0}, {2, 4}}, Triangle[{1, 2, 3}], ImageSize -> {100, 100}]}LabelStyle (1)
Lighting (4)
Ambient light is uniformly applied to all the surfaces in the scene:
MeshRegion[{{0, 0, 0}, {2, 0, 0}, {2, 2, 0}, {0, 2, 0}, {1, 1, 2}}, Pyramid[{1, 2, 3, 4, 5}], Lighting -> {{"Ambient", Orange}}]Directional lights with different colors:
Table[MeshRegion[{{0, 0, 0}, {2, 0, 0}, {2, 2, 0}, {0, 2, 0}, {1, 1, 2}}, Pyramid[{1, 2, 3, 4, 5}], Lighting -> {{"Directional", c, {{1.5, 0, 2}, {0, 0, 0}}}}], {c, {Red, Yellow, Blue}}]Point lights with different colors:
Table[MeshRegion[{{0, 0, 0}, {2, 0, 0}, {2, 2, 0}, {0, 2, 0}, {1, 1, 2}}, Pyramid[{1, 2, 3, 4, 5}], Lighting -> {{"Point", c, {1.5, 0, 3}}}], {c, {Red, Yellow, Blue}}]Spotlights with different colors:
Table[MeshRegion[{{0, 0, 0}, {2, 0, 0}, {2, 2, 0}, {0, 2, 0}, {1, 1, 2}}, Pyramid[{1, 2, 3, 4, 5}], Lighting -> {{"Spot", c, {{1, 1, 2.5}, {1, 1, 2}}, Pi / 8}}], {c, {Red, Yellow, Blue}}]MeshCellHighlight (3)
MeshCellHighlight allows you to specify highlighting for parts of a MeshRegion:
MeshRegion[{{0, 0}, {1, 0}, {2, 1 / 2}, {2, -1 / 2}}, {Line[{1, 2}], Line[{2, 3}], Line[{3, 4}], Line[{4, 2}]},
	MeshCellHighlight -> {{1, All} -> Red, {0, All} -> Green}]
By making faces transparent, the internal structure of a 3D MeshRegion can be seen:
MeshRegion[{{0, 0, 0}, {2, 0, 0}, {2, 2, 0}, {0, 2, 0}, {1, 1, 2}}, {Tetrahedron[{1, 2, 3, 5}], Tetrahedron[{1, 3, 4, 5}]}, MeshCellHighlight -> {{2, All} -> Opacity[0.5, Orange]}]Individual cells can be highlighted using their cell index:
MeshRegion[{{0}, {1}, {2}}, Line[{{1, 2, 3}}], MeshCellHighlight -> {{1, 1} -> {Thick, Red}, {1, 2} -> {Dashed, Green}}]MeshRegion[{{0}, {1}, {2}}, Line[{{1, 2, 3}}], MeshCellHighlight -> {Line[{1, 2}] -> {Thick, Red}, Line[{2, 3}] -> {Dashed, Green}}]MeshCellLabel (3)
MeshCellLabel can be used to label parts of a MeshRegion:
MeshRegion[{{0}, {1}, {2}}, Point[{{1}, {2}, {3}}], MeshCellLabel -> {0 -> "Index"}]Label the vertices and edges of a polygon:
MeshRegion[{{0, 0}, {1, 0}, {1, 1}, {0, 1}}, Polygon[{1, 2, 3, 4}], MeshCellLabel -> {0 -> "Index", 1 -> "Index"}]Individual cells can be labeled using their cell index:
MeshRegion[{{0}, {1}, {2}}, Line[{{1, 2, 3}}], MeshCellLabel -> {{1, 1} -> "x", {1, 2} -> "y"}]MeshRegion[{{0}, {1}, {2}}, Line[{{1, 2, 3}}], MeshCellLabel -> {Line[{1, 2}] -> "x", Line[{2, 3}] -> "y"}]MeshCellMarker (1)
MeshCellMarker can be used to assign values to parts of a MeshRegion:
MeshRegion[{{0}, {1}, {2}}, Point[{{1}, {2}, {3}}], MeshCellMarker -> {{0, 1} -> 1, {0, 2} -> 2, {0, 3} -> 3}]Use MeshCellLabel to show the markers:
MeshRegion[{{0}, {1}, {2}}, Point[{{1}, {2}, {3}}], MeshCellMarker -> {{0, 1} -> 1, {0, 2} -> 2, {0, 3} -> 3}, MeshCellLabel -> {0 -> "Marker"}]MeshCellShapeFunction (2)
MeshCellShapeFunction allows you to specify functions for parts of a MeshRegion:
MeshRegion[{{0, 0}, {1, 0}, {2, 1 / 2}, {2, -1 / 2}}, {Line[{1, 2}], Line[{2, 3}], Line[{3, 4}], Line[{4, 2}]},
	MeshCellShapeFunction -> {1 -> (Arrow[#]&), 0 -> (Disk[#, .1]&)}]
Individual cells can be drawn using their cell index:
MeshRegion[{{0, 0}, {1, 0}, {2, 1 / 2}, {2, -1 / 2}}, {Line[{1, 2}], Line[{2, 3}], Line[{3, 4}], Line[{4, 2}]},
MeshCellShapeFunction -> {{0, 1} -> (Disk[#, .1]&), {0, 2} -> (Disk[#, {.1, .05}]&)}]MeshRegion[{{0, 0}, {1, 0}, {2, 1 / 2}, {2, -1 / 2}}, {Line[{1, 2}], Line[{2, 3}], Line[{3, 4}], Line[{4, 2}]},
MeshCellShapeFunction -> {Point[1] -> (Disk[#, .1]&), Point[2] -> (Disk[#, {.1, .05}]&)}]MeshCellStyle (3)
MeshCellStyle allows you to specify styling for parts of a MeshRegion:
MeshRegion[{{0, 0}, {1, 0}, {2, 1 / 2}, {2, -1 / 2}}, {Line[{1, 2}], Line[{2, 3}], Line[{3, 4}], Line[{4, 2}]},
	MeshCellStyle -> {{1, All} -> Red, {0, All} -> Green}]
By making faces transparent, the internal structure of a 3D MeshRegion can be seen:
MeshRegion[{{0, 0, 0}, {2, 0, 0}, {2, 2, 0}, {0, 2, 0}, {1, 1, 2}}, {Tetrahedron[{1, 2, 3, 5}], Tetrahedron[{1, 3, 4, 5}]}, MeshCellStyle -> {{2, All} -> Opacity[0.5, Orange]}]Individual cells can be styled using their cell index:
MeshRegion[{{0}, {1}, {2}}, Line[{{1, 2, 3}}], MeshCellStyle -> {{1, 1} -> {Thick, Red}, {1, 2} -> {Dashed, Green}}]MeshRegion[{{0}, {1}, {2}}, Line[{{1, 2, 3}}], MeshCellStyle -> {Line[{1, 2}] -> {Thick, Red}, Line[{2, 3}] -> {Dashed, Green}}]PlotLabel (2)
Display a label on the top of the graphic in TraditionalForm:
MeshRegion[{{0, 1}, {2, 0}, {2, 2}}, Triangle[{1, 2, 3}], PlotLabel -> x ^ 2 + y ^ 2 == 1]Use Style and other typesetting functions to modify how the label appears:
MeshRegion[{{-1, 0}, {1, -1}, {1, 1}}, Triangle[{1, 2, 3}], PlotLabel -> Style[Framed[x ^ 2 + y ^ 2 == 1], 16, Red, Background -> Yellow]]PlotRange (3)
MeshRegion[{{0, 1}, {2, 0}, {2, 2}}, Triangle[{1, 2, 3}], Frame -> True, PlotRange -> All]MeshRegion[{{-1, 0}, {1, -1}, {1, 1}}, Triangle[{1, 2, 3}], PlotRange -> {{-1, 1}, {0, 1}}, Frame -> True]Force clipping at the PlotRange:
MeshRegion[{{-1, 0}, {1, -1}, {1, 1}}, Triangle[{1, 2, 3}], PlotRange -> {{-1, 1}, {0, 1}}, PlotRangeClipping -> True, Frame -> True]PlotRange -> s is equivalent to PlotRange -> {{-s, s}, {-s, s}}:
MeshRegion[{{-2, 0}, {2, -2}, {2, 2}}, Triangle[{1, 2, 3}], Frame -> True, PlotRange -> 1]PlotRangeClipping (2)
Allow graphics objects to spread beyond PlotRange:
MeshRegion[{{-2, 0}, {2, -2}, {2, 2}}, Triangle[{1, 2, 3}], Frame -> True, PlotRange -> 1, PlotRangeClipping -> False]Clip all graphics objects at PlotRange:
MeshRegion[{{-2, 0}, {2, -2}, {2, 2}}, Triangle[{1, 2, 3}], Frame -> True, PlotRange -> 1, PlotRangeClipping -> True]PlotRangePadding (3)
Include 1 coordinate unit of padding on all sides:
MeshRegion[{{0, 1}, {2, 0}, {2, 2}}, Triangle[{1, 2, 3}], PlotRangePadding -> 1, Frame -> True]Include padding using Scaled coordinates:
MeshRegion[{{0, 1}, {2, 0}, {2, 2}}, Triangle[{1, 2, 3}], PlotRangePadding -> Scaled[0.1], Frame -> True]Specify different padding on each side:
MeshRegion[{{0, 1}, {2, 0}, {2, 2}}, Triangle[{1, 2, 3}], PlotRangePadding -> {{0.5, 1}, {0.3, 0.3}}, Frame -> True]PlotRegion (3)
The contents of a graphic use the whole region:
MeshRegion[{{0, 1}, {2, 0}, {2, 2}}, Triangle[{1, 2, 3}], Frame -> True, FrameTicks -> False, Background -> StandardBlue]Limit the contents of the graphic to the middle half of the region in each direction:
MeshRegion[{{0, 1}, {2, 0}, {2, 2}}, Triangle[{1, 2, 3}], Frame -> True, FrameTicks -> False, PlotRegion -> {{0.25, 0.75}, {0.25, 0.75}}, Background -> StandardBlue]ImagePadding can also be used to add padding around a graphic:
MeshRegion[{{0, 1}, {2, 0}, {2, 2}}, Triangle[{1, 2, 3}], Frame -> True, FrameTicks -> False, ImagePadding -> 30, Background -> StandardBlue]PlotTheme (9)
Base Themes (2)
MeshRegion[{{0, 0, 0}, {2, 0, 0}, {2, 2, 0}, {0, 2, 0}, {1, 1, 2}}, Pyramid[{1, 2, 3, 4, 5}], PlotTheme -> "Detailed"]MeshRegion[{{0, 0, 0}, {2, 0, 0}, {2, 2, 0}, {0, 2, 0}, {1, 1, 2}}, Pyramid[{1, 2, 3, 4, 5}], PlotTheme -> "Monochrome"]Feature Themes (7)
MeshRegion[{{0, 0, 0}, {2, 0, 0}, {2, 2, 0}, {0, 2, 0}, {1, 1, 2}}, Pyramid[{1, 2, 3, 4, 5}], PlotTheme -> "Points"]Use a theme to draw 1D cells or a wireframe:
MeshRegion[{{0, 0, 0}, {2, 0, 0}, {2, 2, 0}, {0, 2, 0}, {1, 1, 2}}, Pyramid[{1, 2, 3, 4, 5}], PlotTheme -> "Lines"]MeshRegion[{{0, 0, 0}, {2, 0, 0}, {2, 2, 0}, {0, 2, 0}, {1, 1, 2}}, Pyramid[{1, 2, 3, 4, 5}], PlotTheme -> "Polygons"]Use a theme to draw sampled points from mesh cells:
MeshRegion[{{0, 0, 0}, {2, 0, 0}, {2, 2, 0}, {0, 2, 0}, {1, 1, 2}}, Pyramid[{1, 2, 3, 4, 5}], PlotTheme -> "SampledPoints"]Use a theme to draw points as spheres and lines as tubes:
MeshRegion[{{0, 0, 0}, {2, 0, 0}, {2, 2, 0}, {0, 2, 0}, {1, 1, 2}}, Pyramid[{1, 2, 3, 4, 5}], PlotTheme -> "SphereAndTube"]Use a theme to smooth shading:
MeshRegion[{{0, 0, 0}, {2, 0, 0}, {2, 2, 0}, {0, 2, 0}, {1, 1, 2}}, Pyramid[{1, 2, 3, 4, 5}], PlotTheme -> "SmoothShading"]Use a theme to draw normals for each 2D cell:
MeshRegion[{{0, 0, 0}, {2, 0, 0}, {2, 2, 0}, {0, 2, 0}, {1, 1, 2}}, Pyramid[{1, 2, 3, 4, 5}], PlotTheme -> "FaceNormals"]Prolog (1)
Define a simple graphic to use as a background:
bg = Graphics[Polygon[{{0, 0}, {1, 0}, {1, 1}, {0, 1}}, VertexColors -> {Orange, Orange, White, White}], AspectRatio -> Full];Use it in multiple mesh regions:
MeshRegion[{{0, 1}, {2, 0}, {2, 2}}, Triangle[{1, 2, 3}], Prolog -> Inset[bg, Scaled[{0, 0}], Scaled[{0, 0}]]]MeshRegion[{{0, 0}, {1, 0}, {2, 1 / 2}, {2, -1 / 2}}, {Line[{1, 2}], Line[{2, 3}], Line[{3, 4}], Line[{4, 2}]}, Prolog -> Inset[bg, Scaled[{0, 0}], Scaled[{0, 0}]]]RotateLabel (2)
Specify that vertical frame labels should be rotated:
MeshRegion[{{0, 1}, {2, 0}, {2, 2}}, Triangle[{1, 2, 3}], Frame -> True, FrameLabel -> {None, "y axis"}, RotateLabel -> True]Specify that vertical frame labels should not be rotated:
MeshRegion[{{0, 1}, {2, 0}, {2, 2}}, Triangle[{1, 2, 3}], Frame -> True, FrameLabel -> {None, "y axis"}, RotateLabel -> False]SphericalRegion (2)
Make a sequence of images be consistently sized, independent of orientation:
Table[MeshRegion[{{0, 0, 0}, {2, 0, 0}, {2, 2, 0}, {0, 2, 0}, {1, 1, 2}}, Pyramid[{1, 2, 3, 4, 5}], SphericalRegion -> True, ImageSize -> 80, ViewPoint -> 3.{ Sin[t], Cos[t], 1}], {t, 0, 4}]Without SphericalRegion, each image is made as big as possible:
Table[MeshRegion[{{0, 0, 0}, {2, 0, 0}, {2, 2, 0}, {0, 2, 0}, {1, 1, 2}}, Pyramid[{1, 2, 3, 4, 5}], ImageSize -> 80, ViewPoint -> 3.{ Sin[t], Cos[t], 1}], {t, 0, 4}]Ticks (3)
Draw the axes but no tick marks:
MeshRegion[{{0, 1}, {2, 0}, {2, 2}}, Triangle[{1, 2, 3}], Axes -> True, Ticks -> None]Place tick marks automatically:
MeshRegion[{{0, 1}, {2, 0}, {2, 2}}, Triangle[{1, 2, 3}], Axes -> True, Ticks -> Automatic]Draw tick marks at specific positions:
MeshRegion[{{0, 1}, {2, 0}, {2, 2}}, Triangle[{1, 2, 3}], Ticks -> {{1, 2, 3}, {1, 3}}, Axes -> True]TicksStyle (2)
Specify the styles of the ticks and tick labels:
MeshRegion[{{0, 1}, {2, 0}, {2, 2}}, Triangle[{1, 2, 3}], Axes -> True, TicksStyle -> Directive[Red, Bold]]Specify the styles of ![]() and
and ![]() axis ticks separately:
axis ticks separately:
MeshRegion[{{0, 1}, {2, 0}, {2, 2}}, Triangle[{1, 2, 3}], Axes -> True, TicksStyle -> {Directive[Red, Bold], Directive[Blue, 12]}]ViewAngle (1)
ViewCenter (1)
ViewMatrix (1)
Orthographic view of a mesh region from the negative ![]() direction:
direction:
MeshRegion[{{0, 0, 0}, {2, 0, 0}, {2, 2, 0}, {0, 2, 0}, {1, 1, 2}}, Pyramid[{1, 2, 3, 4, 5}], ViewMatrix -> {TransformationMatrix[RescalingTransform[{{-1, 1}, {-1, 1}, {-1, 1}}]], {{1, 0, 0, 0}, {0, 1, 0, 0}, {0, 0, -1, 0}, {0, 0, 0, 1}}}]ViewPoint (3)
Specify the view point using the special scaled coordinates:
MeshRegion[{{0, 0, 0}, {2, 0, 0}, {2, 2, 0}, {0, 2, 0}, {1, 1, 2}}, Pyramid[{1, 2, 3, 4, 5}], ViewPoint -> {Pi, Pi / 2, 2}]{MeshRegion[{{0, 0, 0}, {2, 0, 0}, {2, 2, 0}, {0, 2, 0}, {1, 1, 2}}, Pyramid[{1, 2, 3, 4, 5}], ViewPoint -> Front],
MeshRegion[{{0, 0, 0}, {2, 0, 0}, {2, 2, 0}, {0, 2, 0}, {1, 1, 2}}, Pyramid[{1, 2, 3, 4, 5}], ViewPoint -> Top]}{MeshRegion[{{0, 0, 0}, {2, 0, 0}, {2, 2, 0}, {0, 2, 0}, {1, 1, 2}}, Pyramid[{1, 2, 3, 4, 5}], ViewPoint -> {0, -Infinity, 0}],
MeshRegion[{{0, 0, 0}, {2, 0, 0}, {2, 2, 0}, {0, 2, 0}, {1, 1, 2}}, Pyramid[{1, 2, 3, 4, 5}], ViewPoint -> {0, 0, Infinity}]}ViewRange (2)
By default, the range is sufficient to include all the objects:
MeshRegion[{{0, 0, 0}, {2, 0, 0}, {2, 2, 0}, {0, 2, 0}, {1, 1, 2}}, Pyramid[{1, 2, 3, 4, 5}], ViewPoint -> {1, 0, 1.5}, SphericalRegion -> True]Specify the minimum and maximum distances from the camera to be included:
MeshRegion[{{0, 0, 0}, {2, 0, 0}, {2, 2, 0}, {0, 2, 0}, {1, 1, 2}}, Pyramid[{1, 2, 3, 4, 5}], ViewPoint -> {1, 0, 1.5}, ViewRange -> {3.5, 7.2}, SphericalRegion -> True]ViewVector (1)
ViewVertical (2)
Use the ![]() axis direction as the vertical direction in the final image:
axis direction as the vertical direction in the final image:
MeshRegion[{{0, 0, 0}, {2, 0, 0}, {2, 2, 0}, {0, 2, 0}, {1, 1, 2}}, Pyramid[{1, 2, 3, 4, 5}], ViewVertical -> {1, 0, 0}]Various views of vertical directions:
Table[MeshRegion[{{0, 0, 0}, {2, 0, 0}, {2, 2, 0}, {0, 2, 0}, {1, 1, 2}}, Pyramid[{1, 2, 3, 4, 5}], ViewVertical -> v], {v, {{1, 0, 1}, {.5, 0, 1}, {0, -.5, 1}, {0, -1, 1}}}]Applications (9)
Curves (4)
Extract the lines from a MeshRegion to make a wireframe mesh:
ℛ = VoronoiMesh[RandomReal[1, {50, 2}]]The indices given in MeshCells correspond to MeshCoordinates:
{pts, lines} = {MeshCoordinates[ℛ], MeshCells[ℛ, 1]};wireframe = MeshRegion[pts, lines]RegionDimension /@ {ℛ, wireframe}Area /@ {ℛ, wireframe}ArcLength /@ {ℛ, wireframe}Compute the perimeter of a regular polygon:
RegularLineMesh[n_Integer] :=
MeshRegion[Table[{Cos[k 2π / n], Sin[k 2π / n]}, {k, n}], Line[Append[Range[n], 1]]]rl = Table[RegularLineMesh[n], {n, 3, 10}]ArcLength /@ rlThe perimeter approaches ![]() as the number of sides goes to infinity:
as the number of sides goes to infinity:
Table[ArcLength[RegularLineMesh[n]], {n, {10, 10 ^ 2, 10 ^ 3}}]Create a mesh region of a Koch curve using a Lindenmayer system:
ProductionString[n_] := Characters@Nest[StringReplace[#, {"F" -> "F-F+F+F-F"}]&, "F", n - 1];Define a function for interpreting characters in the production string to coordinates using turtle graphics:
Turtle[pts_, d_]["+"] := Turtle[pts, RotateRight[d]]Turtle[pts_, d_]["-"] := Turtle[pts, RotateLeft[d]]Turtle[{pp___, pt_}, d : {dxdy_, ___}]["F"] := Turtle[{pp, pt, pt + dxdy}, d]Initial parameters for interpreting the production string:
start = {0, 0};
dirs = {{1, 0}, {0, 1}, {-1, 0}, {0, -1}};
Compute coordinates of the Koch curve from the production string:
pts = Table[First@Fold[#1[#2]&, Turtle[{start}, dirs], ProductionString[n]], {n, 4}];Generate mesh regions from the coordinates:
curves = Table[MeshRegion[p, Line[Range@Length@p]], {p, pts}]Find a formula for the length of the Koch curve at iteration ![]() :
:
ArcLength /@ curvesFindSequenceFunction[Rationalize[%], n]Convert a graph to a MeshRegion:
GraphMesh[g_ ? GraphQ] :=
MeshRegion[GraphEmbedding[g], Line[{##}]&@@@EdgeList[UndirectedGraph[g]]]GraphMesh /@ {StarGraph[7], WheelGraph[7], CycleGraph[7], GridGraph[{5, 5}], CompleteKaryTree[4]}You can compute with these as geometric regions:
ArcLength /@ %GraphMesh /@ Graph3D /@ {StarGraph[11], CycleGraph[7], GridGraph[{5, 5, 5}], CompleteKaryTree[4]}You can still compute with them:
ArcLength /@ %You can, for instance, compute the curve integral across these curves:
NIntegrate[x^2y^2z^2, {x, y, z}∈[image]]Surfaces (3)
Create a surface mesh by extruding a 2D curve mesh:
GraphSurfaceMesh[g_ ? GraphQ] :=
	RegionProduct[MeshRegion[GraphEmbedding[g], Line[{##}]&@@@EdgeList[UndirectedGraph[g]]], MeshRegion[{{0}, {1}}, Line[{1, 2}]]]
Some examples with planar layouts:
GraphSurfaceMesh /@ {StarGraph[7], WheelGraph[7], CycleGraph[7], GridGraph[{5, 5}], CompleteKaryTree[4]}You can compute with the resulting regions, in this case computing surface integrals:
NIntegrate[x^2y^2z^2, {x, y, z}∈[image]]Directly generate a rectangular grid mesh. Here IndexFlatten flattens out the position index in the same way that Flatten would flatten it:
IndexFlatten[i_List, d_List] := 1 + FoldList[Times, 1, Most[Reverse[d]]].Reverse[(i - 1)]GridMesh[{{l1_, l2_}, {u1_, u2_}}, {k1_, k2_}] :=
Module[{pa, ia, re},
pa = Table[{x, y}, {x, l1, u1, (u1 - l1) / k1}, {y, l2, u2, (u2 - l2) / k2}];
re = {{1, 1}, {2, 1}, {2, 2}, {1, 2}};
ia = Table[IndexFlatten[#, {k1, k2} + 1]& /@ TranslationTransform[{dx, dy}][re], {dx, 0, k1 - 1}, {dy, 0, k2 - 1}];
MeshRegion[Flatten[pa, 1], Polygon[Flatten[ia, 1]]]
]GridMesh[{{0, 0}, {1, 1}}, {3, 3}]Alternatively, generate the same mesh region as the product of 1D meshes:
mr1d = MeshRegion[{{0}, {1 / 3}, {2 / 3}, {1}}, Line[{1, 2, 3, 4}]]RegionProduct[mr1d, mr1d]Generalize the direct method above to generate a mesh region corresponding to a pattern matrix:
IndexFlatten[i_List, d_List] := 1 + FoldList[Times, 1, Most[Reverse[d]]].Reverse[(i - 1)]PatternGridMesh[a_List] /; MatrixQ[a] :=
Module[{m, n, pa, ia, re},
{m, n} = Dimensions[a];
pa = Table[{x, y}, {x, 0, m}, {y, 0, n}];
re = {{1, 1}, {2, 1}, {2, 2}, {1, 2}};
ia = Table[IndexFlatten[#, {m, n} + 1]& /@ TranslationTransform[ind - 1][re], {ind, Position[a, 1]}];
MeshRegion[Flatten[pa, 1], Polygon[ia]]
]PatternGridMesh[{{1, 0}, {0, 1}}]PatternGridMesh[Table[If[Mod[i, 4] == 2 && Mod[j, 4] == 2, 0, 1], {i, 11}, {j, 11}]]PatternGridMesh[CellularAutomaton[30, {{1}, 0}, 50]]Volumes (2)
Directly generate a rectangular grid mesh. Here IndexFlatten flattens out the position index in the same way that Flatten would flatten it:
IndexFlatten[i_List, d_List] := 1 + FoldList[Times, 1, Most[Reverse[d]]].Reverse[(i - 1)]GridMesh[{{l1_, l2_, l3_}, {u1_, u2_, u3_}}, {k1_, k2_, k3_}] :=
Module[{pa, ia, re},
pa = Table[{x, y, z}, {x, l1, u1, (u1 - l1) / k1}, {y, l2, u2, (u2 - l2) / k2}, {z, l3, u3, (u3 - l3) / k3}];
re = {{1, 1, 1}, {2, 1, 1}, {2, 2, 1}, {1, 2, 1}, {1, 1, 2}, {2, 1, 2}, {2, 2, 2}, {1, 2, 2}};
ia = Table[IndexFlatten[#, {k1, k2, k3} + 1]& /@ TranslationTransform[{dx, dy, dz}][re], {dx, 0, k1 - 1}, {dy, 0, k2 - 1}, {dz, 0, k3 - 1}];
MeshRegion[Flatten[pa, 2], Hexahedron[Flatten[ia, 2]]]
]GridMesh[{{0, 0, 0}, {1, 1, 1}}, {3, 3, 3}]Alternatively, generate the same mesh region as the product of 1D meshes:
mr1d = MeshRegion[{{0}, {1 / 3}, {2 / 3}, {1}}, Line[{1, 2, 3, 4}]]RegionProduct[mr1d, mr1d, mr1d]Generalize the direct method above to generate a mesh region corresponding to a pattern matrix:
IndexFlatten[i_List, d_List] := 1 + FoldList[Times, 1, Most[Reverse[d]]].Reverse[(i - 1)]PatternGridMesh[a_List] /; ArrayQ[a] && ArrayDepth[a] == 3 :=
Module[{m, n, p, pa, ia, re},
{m, n, p} = Dimensions[a];
pa = Table[{x, y, z}, {x, 0, m}, {y, 0, n}, {z, 0, p}];
re = {{1, 1, 1}, {2, 1, 1}, {2, 2, 1}, {1, 2, 1}, {1, 1, 2}, {2, 1, 2}, {2, 2, 2}, {1, 2, 2}};
ia = Table[IndexFlatten[#, {m, n, p} + 1]& /@ TranslationTransform[ind - 1][re], {ind, Position[a, 1]}];
MeshRegion[Flatten[pa, 2], Hexahedron[ia]]
]PatternGridMesh[{{{1, 1, 1}, {1, 0, 1}, {1, 1, 1}},
{{1, 1, 1}, {1, 0, 1}, {1, 1, 1}}, {{1, 1, 1}, {1, 0, 1}, {1, 1, 1}}}]PatternGridMesh[CellularAutomaton[{14, {2, 1}, {1, 1}}, {{{1}}, 0}, 10]]Use the idea above to construct a Seidel mesh, i.e. a mesh region with tunnels going in every direction without crossing:
SeidelMesh[{r_, s_, t_}] :=
PatternGridMesh[Table[If[Mod[i, 4] == 2 && Mod[j, 4] == 2 || Mod[i, 4] == 0 && Mod[k, 4] == 0 || Mod[j, 4] == 0 && Mod[k, 4] == 2, 0, 1], {i, 3 + r 4}, {j, 3 + s 4}, {k, 3 + t 4}]]SeidelMesh[{1, 1, 1}]By converting to a boundary mesh and styling it, it becomes easier to comprehend:
HighlightMesh[BoundaryMesh@SeidelMesh[{2, 2, 2}], {Style[1, None], Style[2, Opacity[0.5]]}]HighlightMesh[BoundaryMesh@SeidelMesh[{4, 4, 4}], {Style[1, None], Style[2, Opacity[0.5]]}]Properties & Relations (9)
MeshRegion can have any geometric dimension:
point = MeshRegion[{{0, 0}}, {Point[1]}];
line = MeshRegion[{{0, 0}, {1, 1}}, {Line[{1, 2}]}];
polygon = MeshRegion[{{0, 0}, {1, 0}, {1, 1}}, {Polygon[{1, 2, 3}]}];
polytope = MeshRegion[{{0, 0, 0}, {1, 0, 0}, {0, 1, 0}, {0, 0, 1}}, {Tetrahedron[{1, 2, 3, 4}]}];RegionDimension /@ {point, line, polygon, polytope}MeshRegion is always bounded:
ℛ = MeshRegion[{{0, 0}, {1, 0}, {0, 1}}, Polygon[{1, 2, 3}]];Use BoundedRegionQ to test and RegionBounds for actual bounds:
{BoundedRegionQ[ℛ], rr = RegionBounds[ℛ]}Show[ℛ, Graphics[{EdgeForm[Directive[Dashed, Red]], Yellow, Opacity[0.1], Cuboid@@Transpose[rr]}]]MeshRegionQ can be used to test whether a region is a MeshRegion:
ℛ = MeshRegion[{{0, 0}, {1, 0}, {0, 1}}, Polygon[{1, 2, 3}]]MeshRegionQ[ℛ]Use DelaunayMesh to create a MeshRegion from a set of points:
{p2, p3} = RandomReal[1, {20, #}]& /@ {2, 3};DelaunayMesh /@ {p2, p3}Use TriangulateMesh to convert a BoundaryMeshRegion to a MeshRegion:
ℛ = BoundaryMeshRegion[{{0, 0}, {1, 0}, {1, 1}}, Line[{1, 2, 3, 1}]]TriangulateMesh[ℛ]Use DiscretizeRegion to convert any region to MeshRegion:
DiscretizeRegion[ImplicitRegion[x ^ 2 + y ^ 2 ≤ 1, {x, y}]]Use DiscretizeGraphics to convert Graphics to MeshRegion:
g = Graphics[{Orange, Disk[{2, 2}], Brown, Rectangle[{0, 0}, {2, 2}], Line[{{0, 0}, {4, 0}}]}]DiscretizeGraphics[g]MeshRegionQ[%]Use Show to convert any MeshRegion to Graphics:
ℛ = MeshRegion[{{0, 0}, {1, 0}, {0, 1}}, Polygon[{1, 2, 3}]]Show[ℛ]//InputFormMeshRegion is usually more memory intensive than BoundaryMeshRegion:
pts = RandomReal[1, {50, 2}];
ℛ1 = DelaunayMesh[pts];
ℛ2 = BoundaryMesh[ℛ1];{ℛ1, ℛ2}ByteCount /@ {ℛ1, ℛ2}Text
Wolfram Research (2014), MeshRegion, Wolfram Language function, https://reference.wolfram.com/language/ref/MeshRegion.html (updated 2022).
CMS
Wolfram Language. 2014. "MeshRegion." Wolfram Language & System Documentation Center. Wolfram Research. Last Modified 2022. https://reference.wolfram.com/language/ref/MeshRegion.html.
APA
Wolfram Language. (2014). MeshRegion. Wolfram Language & System Documentation Center. Retrieved from https://reference.wolfram.com/language/ref/MeshRegion.html