

DelaunayMesh
DelaunayMesh[{p1,p2,…}]
gives a MeshRegion representing the Delaunay mesh from the points p1, p2, ….
Details and Options
- DelaunayMesh is also known as Delaunay triangulation and Delaunay tetrahedralization.
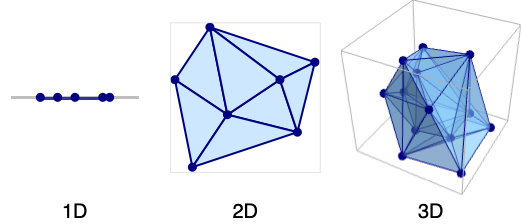
- A Delaunay mesh consists of intervals (in 1D), triangles (in 2D), tetrahedra (in 3D), and
 -dimensional simplices (in
  D).
D). - A Delaunay mesh has simplex cells defined by
 points, such that the circumsphere for the same
  points contains no other points from the original points pi.
 - The Delaunay mesh gives a triangulation where the minimum interior angle is maximized.
- DelaunayMesh takes the same options as MeshRegion.
Examples
open all close allBasic Examples (4)
pts = RandomReal[{-1, 1}, {5, 1}];DelaunayMesh[pts];HighlightMesh[%, Style[0, Red]]A 2D Delaunay mesh from a list of points:
pts = RandomReal[{-1, 1}, {50, 2}];ℛ = DelaunayMesh[pts];HighlightMesh[ℛ, Style[0, Red]]A 3D Delaunay mesh from a list of points:
pts = RandomReal[{-1, 1}, {25, 3}];ℛ = DelaunayMesh[pts];HighlightMesh[ℛ, {Style[0, Directive[PointSize[Medium], Red]], Style[2, Opacity[0.1]]}]Delaunay mesh from points corresponding to minimal vectors of the hexagonal close packing lattice:
LatticeData["HexagonalClosePacking", "MinimalVectors"]DelaunayMesh[%]Scope (3)
Create a 1D Delaunay mesh from a set of points:
pts = RandomReal[{-1, 1}, {20, 1}];ℛ = DelaunayMesh[pts]{RegionQ[ℛ], MeshRegionQ[ℛ]}Delaunay meshes are full dimensional:
{RegionDimension[ℛ], RegionEmbeddingDimension[ℛ]}{BoundedRegionQ[ℛ], RegionBounds[ℛ]}Find its measure and centroid:
{RegionMeasure[ℛ], RegionCentroid[ℛ]}Find nearest distance and nearest point:
{RegionDistance[ℛ, {2}], RegionNearest[ℛ, {2}]}RegionMember[ℛ, {0.5}]Create a 2D Delaunay mesh from a set of points:
pts = RandomReal[{-1, 1}, {50, 2}];ℛ = DelaunayMesh[pts]{RegionQ[ℛ], MeshRegionQ[ℛ]}Delaunay meshes are full dimensional:
{RegionDimension[ℛ], RegionEmbeddingDimension[ℛ]}{BoundedRegionQ[ℛ], RegionBounds[ℛ]}{RegionMeasure[ℛ], RegionCentroid[ℛ]}Test for point membership or distance to the closest point in the region:
RegionMember[ℛ, {0.5, 0.5}]{RegionDistance[ℛ, {2, 2}], RegionNearest[ℛ, {2, 2}]}Create a 3D Delaunay mesh from a set of points:
pts = RandomReal[{-1, 1}, {50, 3}];ℛ = DelaunayMesh[pts]{RegionQ[ℛ], MeshRegionQ[ℛ]}Delaunay meshes are full dimensional:
{RegionDimension[ℛ], RegionEmbeddingDimension[ℛ]}{BoundedRegionQ[ℛ], RegionBounds[ℛ]}{RegionMeasure[ℛ], RegionCentroid[ℛ]}Test for point membership or distance to the closest point in the region:
RegionMember[ℛ, {0.5, 0.5, 0.5}]{RegionDistance[ℛ, {2, 2, 2}], RegionNearest[ℛ, {2, 2, 2}]}Options (11)
MeshCellHighlight (2)
MeshCellHighlight allows you to specify highlighting for parts of a DelaunayMesh:
DelaunayMesh[{{0, 0}, {1, 0}, {0, 1}, {1, 1}}, MeshCellHighlight -> {{1, All} -> Red, {0, All} -> Green}]Individual cells can be highlighted using their cell index:
DelaunayMesh[{{0, 0}, {1, 0}, {0, 1}, {1, 1}}, MeshCellHighlight -> {{1, 1} -> {Thick, Red}, {1, 2} -> {Dashed, Black}}]DelaunayMesh[{{0, 0}, {1, 0}, {0, 1}, {1, 1}}, MeshCellHighlight -> {Line[{1, 2}] -> {Thick, Red}, Line[{2, 3}] -> {Dashed, Black}}]MeshCellLabel (2)
MeshCellLabel can be used to label parts of a DelaunayMesh:
DelaunayMesh[{{0, 0}, {1, 0}, {0, 1}, {1, 1}}, MeshCellLabel -> {0 -> "Index"}]Individual cells can be labeled using their cell index:
DelaunayMesh[{{0, 0}, {1, 0}, {0, 1}, {1, 1}}, MeshCellLabel -> {{1, 1} -> "x", {1, 2} -> "y"}]DelaunayMesh[{{0, 0}, {1, 0}, {0, 1}, {1, 1}}, MeshCellLabel -> {Line[{1, 3}] -> "x", Line[{1, 2}] -> "y"}]MeshCellMarker (1)
MeshCellMarker can be used to assign values to parts of a DelaunayMesh:
DelaunayMesh[{{0, 0}, {1, 0}, {0, 1}, {1, 1}}, MeshCellMarker -> {{0, 1} -> 1, {0, 2} -> 2, {0, 3} -> 3, {0, 4} -> 4}]Use MeshCellLabel to show the markers:
DelaunayMesh[{{0, 0}, {1, 0}, {0, 1}, {1, 1}}, MeshCellMarker -> {{0, 1} -> 1, {0, 2} -> 2, {0, 3} -> 3, {0, 4} -> 4}, MeshCellLabel -> {0 -> "Marker"}]MeshCellShapeFunction (2)
MeshCellShapeFunction allows you to specify functions for parts of a DelaunayMesh:
DelaunayMesh[{{0, 0}, {1, 0}, {0, 1}}, MeshCellShapeFunction -> {0 -> (Disk[#, .1]&)}]Individual cells can be drawn using their cell index:
DelaunayMesh[{{0, 0}, {1, 0}, {0, 1}}, MeshCellShapeFunction -> {{0, 1} -> (Disk[#, .1]&), {0, 2} -> (Disk[#, {.1, .2}]&)}]DelaunayMesh[{{0, 0}, {1, 0}, {0, 1}}, MeshCellShapeFunction -> {Point[1] -> (Disk[#, .1]&), Point[2] -> (Disk[#, {.1, .2}]&)}]MeshCellStyle (2)
MeshCellStyle allows you to specify styling for parts of a DelaunayMesh:
DelaunayMesh[{{0, 0}, {1, 0}, {0, 1}, {1, 1}}, MeshCellStyle -> {{1, All} -> Red, {0, All} -> Green}]Individual cells can be highlighted using their cell index:
DelaunayMesh[{{0, 0}, {1, 0}, {0, 1}, {1, 1}}, MeshCellStyle -> {{1, 1} -> {Thick, Red}, {1, 2} -> {Dashed, Black}}]DelaunayMesh[{{0, 0}, {1, 0}, {0, 1}, {1, 1}}, MeshCellStyle -> {Line[{1, 3}] -> {Thick, Red}, Line[{1, 2}] -> {Dashed, Green}}]Applications (5)
Generate lattice points of a 3D lattice basis:
b = LatticeData["FaceCenteredCubic", "Basis"]p = Tuples[Range[0, 3], 3].b;Construct and visualize the mesh region:
m = DelaunayMesh[p]Construct a 3D region from a point set:
pts = ExampleData[{"Geometry3D", "UtahTeapot"}, "VertexData"];dm = DelaunayMesh[pts];Compare original region to Delaunay mesh:
teapot = ExampleData[{"Geometry3D", "UtahTeapot"}, "Graphics3D"];{teapot, dm}Visualize the piecewise constant interpolation of city elevations in Colorado:
data = Table[QuantityMagnitude@CityData[c, p], {c, CityData[{Large, "Germany"}]}, {p, {"Longitude", "Latitude", "Elevation"}}]//Select[FreeQ[#, _Missing]&];Voronoi mesh from city coordinates:
dm = DelaunayMesh[QuantityMagnitude[data[[All, {1, 2}]]]];Create a function to map a given coordinate pair to the nearest known elevation:
nearest = Nearest[Function[{x, y, z}, {x, y} -> z]@@@data];Function to rescale elevation values to ![]() , suitable for color functions:
, suitable for color functions:
rescale = With[{min = Min[data[[All, 3]]], max = Max[data[[All, 3]]]}, Function[v, Rescale[v, {min, max}]]];Piecewise constant contour plot of city elevations:
Graphics[Table[{ColorData["M10DefaultDensityGradient"]@@Composition[rescale, nearest, Mean]@@p, EdgeForm[Gray], p}, {p, MeshPrimitives[dm, 2]}], Frame -> True, AspectRatio -> 1]A similar plot can also be achieved with ListContourPlot:
ListContourPlot[data, Mesh -> All, MeshStyle -> Gray, ColorFunction -> ColorData["M10DefaultDensityGradient"]]Solve a PDE over a region defined by point set:
pts = RandomReal[1, {100, 2}];ℛ = DelaunayMesh[pts];Show[ℛ, Graphics[Point[pts]]]uifWave = NDSolveValue[{D[u[t, x, y], {t, 2}] - D[u[t, x, y], {x, 2}] - D[u[t, x, y], {y, 2}] == 0, u[0, x, y] == Exp[-5((x - 1.5) ^ 2 + (y - 1.5) ^ 2)], u^(1, 0, 0)[0, x, y] == 0, DirichletCondition[u[t, x, y] == 0, True]}, u, {t, 0, 2π}, {x, y}∈ℛ, Method -> {"EquationSimplification" -> "MassMatrix"}]Plot3D[uifWave[5, x, y], {x, y}∈ℛ, PlotRange -> RegionBounds[ℛ], Boxed -> False, Axes -> False]Create a mesh from selected points on a raster:
img = ImageResize[ExampleData[{"TestImage", "Mandrill"}], 216]pts = {{108, 174}, {136, 61}, {49, 142}, {71, 61}, {83, 124}, {165, 145}, {127, 124}, {0, 216}, {0, 4}, {64, 38}, {216, 0}, {216, 216}, {59, 204}, {160, 204}, {59, 182}, {159, 180}, {138, 39}, {100, 23}, {66, 163}, {151, 169}};Function to convert a raster and a mesh region to polygons:
toPolygons = Function[{img, reg}, Graphics[Table[{RGBColor@ImageValue[img, Mean@@p], p}, {p, MeshPrimitives[reg, "Polygons"]}], ImageSize -> 260]];Function to create an overlay mesh:
overlay = Function[reg, Graphics[{Thickness@0.015, MeshPrimitives[reg, "Lines"]}, Background -> White]];![]() Click the image to add and remove draggable vertices:
Click the image to add and remove draggable vertices:
DynamicModule[{p = pts}, {LocatorPane[Dynamic@p, Pane[Dynamic@ImageCompose[img, {overlay[DelaunayMesh[p]], 0.25}]], LocatorAutoCreate -> True], Pane[Dynamic@toPolygons[img, DelaunayMesh[p]], ImageSize -> 232, ImageSizeAction -> "ShrinkToFit"]}, SaveDefinitions -> True]Properties & Relations (7)
The output of DelaunayMesh is always a full-dimensional MeshRegion:
DelaunayMesh[RandomReal[1, {10, 2}]]{MeshRegionQ[%], RegionDimension[%]}DelaunayMesh consists of intervals in 1D:
DelaunayMesh[{{1}, {2}, {3}}]MeshCells[%, RegionDimension[%]]DelaunayMesh[{{0, 0}, {1, 0}, {0, 1}, {1, 1}}]MeshCells[%, RegionDimension[%]]DelaunayMesh[{{0, 0, 0}, {1, 0, 0}, {0, 1, 0}, {0, 0, 1}, {1, 1, 0}}]MeshCells[%, RegionDimension[%]]The circumcircle for each triangle in a DelaunayMesh contains no other point:
ℛ = DelaunayMesh[RandomReal[1, {5, 2}]]Find circumcircles for all triangles:
circles = Circumsphere@@@Normal@GraphicsComplex[MeshCoordinates[ℛ], MeshCells[ℛ, 2]];Plot the circumcircles as disks:
Show[HighlightMesh[ℛ, Style[0, PointSize[Large]]], Graphics[{Orange, circles}], PlotRange -> {{0, 1}, {0, 1}}]The circumsphere for each tetrahedron in a DelaunayMesh contains no other point:
ℛ = DelaunayMesh[{{0, 0, 0}, {1, 0, 0}, {0, 1, 0}, {0, 0, 1}, {0, 0, -1}}]Find circumspheres for all tetrahedra:
spheres = Circumsphere@@@Normal@GraphicsComplex[MeshCoordinates[ℛ], MeshCells[ℛ, 3]];Show[HighlightMesh[ℛ, {Style[0, PointSize[Medium]], Style[2, Opacity[0.5]]}], Graphics3D[{Opacity[0.2], Orange, spheres}], PlotRange -> RegionBounds[ℛ], PlotRangePadding -> 0.5]ConvexHullMesh is effectively the BoundaryMesh of a DelaunayMesh:
pts = RandomReal[1, {5, 2}];{BoundaryMesh[DelaunayMesh[pts]], ConvexHullMesh[pts]}Use TriangulateMesh to retriangulate a region:
pts = RandomReal[1, {5, 2}];DelaunayMesh[pts]TriangulateMesh[%]VoronoiMesh is the dual of the DelaunayMesh:
pts = RandomReal[1, {10, 2}];delaunay = HighlightMesh[DelaunayMesh[pts], {Style[0, Black], Style[1, Orange], Style[2, Opacity[0.5]]}];voronoi = HighlightMesh[VoronoiMesh[pts], {Style[1, Green], Style[2, Opacity[0.2]]}];Each Voronoi cell has a single point from the original point set:
Show[delaunay, voronoi]Text
Wolfram Research (2014), DelaunayMesh, Wolfram Language function, https://reference.wolfram.com/language/ref/DelaunayMesh.html (updated 2015).
CMS
Wolfram Language. 2014. "DelaunayMesh." Wolfram Language & System Documentation Center. Wolfram Research. Last Modified 2015. https://reference.wolfram.com/language/ref/DelaunayMesh.html.
APA
Wolfram Language. (2014). DelaunayMesh. Wolfram Language & System Documentation Center. Retrieved from https://reference.wolfram.com/language/ref/DelaunayMesh.html