

TransformColumns
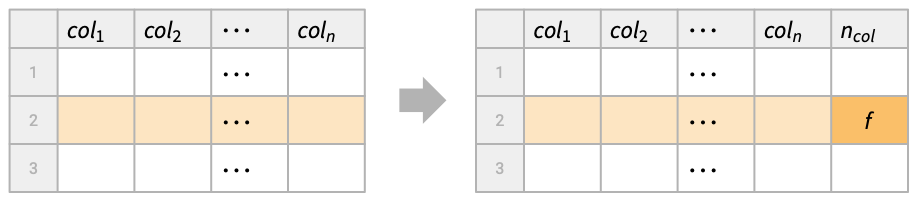
TransformColumns[tab,ncolf]
adds a new column with name ncol by transforming the tabular data tab using the function f applied to each row.
TransformColumns[tab,{ncol1f1,ncol2f2,…}]
adds several new columns ncoli by successively applying the functions fi to each row.
TransformColumns[transfs]
represents an operator form of TransformColumns that can be applied to tabular data.
Details and Options
- TransformColumns is typically used to add new columns or modify existing columns, keeping the rest.
- Possible forms of tabular data tab include:
-
Tabular[…] type-consistent tabular data Dataset[…] general hierarchical data TimeSeries[…] collection of sampled time-value pairs EventSeries[…] series of temporal events {assoc1,assoc2,…} list of associations with common keys matrix matrix of values - If the column ncoli already exists, it is replaced with the newly created one. Otherwise, a new column is added after the existing ones.
- TransformColumns[tab,{col,ncolf}] adds a new column named ncol after the existing column col, instead of appending it at the end.
- For tabular data atab without column keys, TransformColumns[atab,{f1,f2,…,fn}] appends n new anonymous columns by successively applying the functions fi to each row.
- Functions fi are applied to individual rows of the input tabular data tab, with the row being an association <col1val1,…> if tab has column keys or a list {val1,…} if tab does not have column keys.
- The syntax colNothing can be used to remove the existing column named col. »
- TransformColumns[transfs][tab] is equivalent to TransformColumns[tab,transfs].
Examples
open all close allBasic Examples (3)
Transform the difference of columns "a" and "b" into a new column "c":
tab = Tabular[{{2, 2.78}, {1, 3.14}, {3, 1.68}}, {"a", "b"}]TransformColumns[tab, "c" -> Function[#b - #a]]Double the column "a" and halve the column "b":
TransformColumns[tab, {"a" -> (2#a&), "b" -> (#b / 2&)}]Transform existing columns into a new column:
tab = Tabular[{{2004, 4, 1}, {2005, 4, 3}, {2006, 4, 5}}, {"a", "b", "c"}]TransformColumns[tab, "date" -> Function[DateObject[{#a, #b, #c}, "Day"]]]Fetch the population and area of the Central American countries, expressed in Tabular form:
tab = EntityValue[EntityClass["Country", "CentralAmerica"], {"Population", "Area"}, "Tabular"]Compute population density for each country:
TransformColumns[tab, "Density" -> Function[#Population / #Area]]Scope (18)
Transformations (7)
Transform an existing column in a Tabular object:
Tabular[{{1, 2}, {3, 4}}, {"a", "b"}]TransformColumns[%, "a" -> Function[#a ^ 2]]Split an existing column in a Tabular object:
Tabular[{{1, {2004, 1}}, {3, {2005, 3}}, {5, {2006, 2}}}, {"a", "b"}]TransformColumns[%, {"year" -> (First[#b]&), "month" -> (Last[#b]&), "b" -> Nothing}]TransformColumns with a function f acts on whole rows as associations if columns are named:
Tabular[{<|"c1" -> Subscript[x, 11], "c2" -> Subscript[x, 12]|>, <|"c1" -> Subscript[x, 21], "c2" -> Subscript[x, 22]|>, <|"c1" -> Subscript[x, 31], "c2" -> Subscript[x, 32]|>}]TransformColumns[%, "new" -> f]On a Tabular object with anonymous columns, the rows are expressed as lists:
Tabular[{{Subscript[x, 11], Subscript[x, 12]}, {Subscript[x, 21], Subscript[x, 22]}, {Subscript[x, 31], Subscript[x, 32]}}]TransformColumns[%, f]Use the operator form of TransformColumns:
tab = Tabular[{{1, 2}, {3, 4}, {5, 6}}, {"a", "b"}]op = TransformColumns["b" -> Function[#b + 10]];op[tab]Use "a"Nothing to remove column "a" from the result:
tab = Tabular[{<|"a" -> 1, "b" -> 2, "c" -> 3, "d" -> 4|>}];
TransformColumns[tab, {"e" -> (50&), "f" -> (60&), "a" -> Nothing}]
Remove three columns from the result:
TransformColumns[tab, {"e" -> (50&), "f" -> (60&), {"a", "c", "d"} -> Nothing}]Add the second and fourth columns to make a fifth column in a matrix:
tab = Tabular[{{1, 2, 3, 5}, {8, 7, 6, 4}}];
TransformColumns[tab, #1[[2]] + #1[[4]]&]
With Apply around the function, there is an argument for each column:
TransformColumns[tab, Apply[#2 + #4&]]Use Key in the Function body of Tabular transformations when the key is a general expression:
tab = ToTabular[{f[x] -> Power[Sin[x] ^ Range[5]]}, "Columns"]TransformColumns[tab, f'[x] -> Function[D[#[Key[f[x]]], x]]]TransformColumns[tab, f'[x] -> Function[D[Slot[Key[f[x]]], x]]]Input Data (3)
Transform a list of associations:
data = {<|"a" -> 1, "b" -> 2|>, <|"a" -> 3, "b" -> 4|>};TransformColumns[data, "a" -> Function[#a ^ 2]]Create a new column as a function of existing columns:
TransformColumns[data, "c" -> Function[#a + #b]]Transform a Dataset object:
dataset = Dataset[{<|"a" -> 2, "b" -> "foo"|>, <|"a" -> 3, "b" -> "bar"|>}]TransformColumns[dataset, "a" -> Function[#a ^ 2]]Transform the columns of a normal matrix:
MatrixForm[matrix = {{1, "one"}, {2, "two"}, {3, "three"}}]TransformColumns[matrix, Total]TransformColumns[matrix, {f, g}]Columnwise Operations (4)
Use ColumnwiseValue to subtract the mean of a column from its values:
tab = ToTabular[<|"c" -> {3.71, -2.7, -5.29, 9.33, 6.26}|>, "Columns"];
TransformColumns[tab, "c-μ" -> (#c - ColumnwiseValue[Mean[#c]]&)]
Find which elements in a column are above the median:
tab = ToTabular[<|"c" -> {4.24, 1.14, -7.38, 6.74, 6.22, 7.5}|>, "Columns"];TransformColumns[tab, "above median" -> (#c > ColumnwiseValue[Median[#c]]&)]Include a constant column with the median value:
TransformColumns[tab, {"median" -> (ColumnwiseValue[Median[#c]]&), "above median" -> (#c > ColumnwiseValue[Median[#c]]&)}]Compute the median only once by using the operator form:
(TransformColumns["median" -> (ColumnwiseValue[Median[#c]]&)] /* TransformColumns["above_median" -> (#c > #median&)])[tab]Use ColumnwiseThread to compute a vector-valued transformation of entire columns:
tab = ToTabular[<|"v" -> {2.07, -0.75, 4.16, 7.28, 8.63, 7.93}|>, "Columns"];
TransformColumns[tab, "a" -> (ColumnwiseThread[Accumulate[#v]]&)]
With ColumnwiseValue, you get the same list for each row:
TransformColumns[tab, "alist" -> (ColumnwiseValue[Accumulate[#v]]&)]Take a Tabular object:
tab = ToTabular[{"old" -> {a, b, c}}, "Columns"]TransformColumns by default operates sequentially on each row:
TransformColumns[tab, "new" -> Function[Echo[#old, "row: "] + Echo[RandomInteger[5], " random: "]]]TransformColumns with ColumnwiseValue[expr] evaluates expr once first, then acts on each row:
TransformColumns[tab, "new" -> Function[Echo[#old, "row: "] + ColumnwiseValue[Echo[Total[#old], "total: "]]]]TransformColumns with ColumnwiseThread[expr] evaluates expr once, acting on whole columns:
TransformColumns[tab, "new" -> Function[ColumnwiseThread[Echo[#old, "column: "] + Echo[RandomInteger[5], " random: "]]]]Placement of Columns (2)
Take a Tabular object:
tab = Tabular[{<|"a" -> 1, "b" -> 2, "c" -> 3|>, <|"a" -> 10, "b" -> 20, "c" -> 30|>}]By default, TransformColumns places new columns at the end:
TransformColumns[tab, "new" -> Function[#b + #c]]Use column "b" as an anchor column after which the new column is placed:
TransformColumns[tab, {"b", "new" -> Function[#b + #c]}]Place the new column after column "a":
TransformColumns[tab, {"a", "new" -> Function[#b + #c]}]Place the new column before column "a":
TransformColumns[tab, {"new" -> Function[#b + #c], "a"}]Use column names without a transformation to anchor column placement in the result:
tab = Tabular[{<|"a" -> 1, "b" -> 2, "c" -> 3, "d" -> 4|>}];
TransformColumns[tab, {"e" -> (50&), "f" -> (60&), "a"}]
By default, new columns are appended on the right:
TransformColumns[tab, {"e" -> (50&), "f" -> (60&)}]Place "e" before "a" and "f" after "b":
TransformColumns[tab, {"e" -> (50&), "a", "b", "f" -> (60&)}]Place "e" first and "f" after "b" and remove "a" from the result:
TransformColumns[tab, {"e" -> (50&), "a", "b", "f" -> (60&), "a" -> Nothing}]Missing Fallback (2)
Use MissingFallback to fill in missing values when transforming a Tabular object:
tab = Tabular[{{1, 3, 5}, {2, Missing[], 6}}, {"a", "b", "c"}]Use row values from the previous column:
TransformColumns[tab, "b" -> Function[MissingFallback[#b, #a]]]Use row values from the next column:
TransformColumns[tab, "b" -> Function[MissingFallback[#b, #c]]]TransformColumns[tab, "b" -> Function[MissingFallback[#b, -99]]]Use functions of columns in MissingFallback to fill in missing values when transforming a Tabular object:
tab = Tabular[{{1, 3, 5}, {2, Missing[], 6}, {7, 8, 9}}, {"a", "b", "c"}]Use the sum of row values from other columns:
TransformColumns[tab, "b" -> Function[MissingFallback[#b, #a + #c]]]Use the mean of row values from neighboring columns:
TransformColumns[tab, "b" -> Function[MissingFallback[#b, Mean[{#a, #c}]]]]Applications (4)
Medical Data (1)
This data contains information on kidney transplant patients—time in days to death or on-study time since transplant at the given age:
name = {"Statistics", "KidneyTransplant"};
ExampleData[name, "ColumnDescriptions"]Tabular[ExampleData[name], ExampleData[name, "ColumnHeadings"]]Use TransformColumns to give meaning to the numerically encoded data:
transplants = TransformColumns[%, {"Delta" -> (#Delta /. {0 -> "dead", 1 -> "alive"}&), "Gender" -> (#Gender /. {1 -> "male", 2 -> "female"}&), "Race" -> (#Race /. {1 -> "white", 2 -> "black"}&)}]Now use the categories to compute mean survival time in years with PivotTable:
PivotTable[transplants, UnitConvert[Quantity[Mean[#Time], "Days"], "Years"]&, "Race", "Gender", IncludeGroupAggregates -> True]Weather Data (1)
Weather data from JFK airport in C, mbar and km/h:
data = Tabular[IconizedObject[«JFK weather»]]Remove the rows containing at least one missing value:
data1 = Discard[data, Count[#, _Missing] > 0&]Define the wind chill factor (adapt the formula to the units of data):
chill[t_, v_] := If[t > 10 || v < 5, t, 13.12 + 0.6215 * t + (0.3965 * t - 11.37) * (v ^ 0.16), Missing[]];Create a Tabular object with new column:
TransformColumns[data1, {"date", "temperature", "wind_chill" -> Function[chill[#temperature, #"wind_speed"]]}]DateListPlot[% -> {{"date", "temperature"}, {"date", "wind_chill"}}, PlotLegends -> {"temperature", "wind_chill"}]Lake Mead Levels (1)
Time series of Lake Mead water levels:
ts = TemporalData[TimeSeries, {{{Missing[], Quantity[708.7, "Feet"], Quantity[701.7, "Feet"],
    Quantity[752.4, "Feet"], Quantity[806.6, "Feet"], Quantity[909.1, "Feet"],
    Quantity[928.4, "Feet"], Quantity[925.9, "Feet"], Quantity[920.8, "Feet"], ... fication[DateObject[{1935, 1, 31}, "Day"], {2024, 6, 30, 0, 0, 0},
    "EndOfMonth", "DayRange"]}, 1, {"Continuous", 1}, {"Discrete", 1}, 1,
  {ResamplingMethod -> {"Interpolation", InterpolationOrder -> 1}, ValueDimensions -> 1}}, True,
 14.2];
Create a Tabular object:
tab1 = ToTabular[ts, "TimeSeries"]Split the dates into year and month columns using TransformColumns and remove "Date" column:
tab2 = TransformColumns[tab1, {"Year" -> Function[DateValue[#Date, "Year"]], "Month" -> Function[DateValue[#Date, "MonthName"]], "Date" -> Nothing}]Use PivotToColumns to convert into a more compact form for visualization:
tab3 = PivotToColumns[tab2, "Month" -> "Value"]Tree Data (1)
Get the data of a tree census in New York City:
tab = ResourceData["Sample Tabular Data: NYC Trees"]ColumnKeys[tab]Use TransformColumns to combine "latitude" and "longitude" columns into one column of GeoPosition objects and place it after the "longitude" column:
newtab = TransformColumns[tab, {"longitude", "geoposition" -> Function[GeoPosition[{#latitude, #longitude}]]}]ColumnKeys[newtab]Use the "geoposition" column to plot the first 1000 tree locations:
GeoGraphics[Point[Normal[newtab[ ;; 1000, "geoposition"]]]]Properties & Relations (3)
TransformColumns keeps all the columns not being transformed:
tab = Tabular[{{1, 2}, {3, 4}, {5, 6}}, {"a", "b"}]TransformColumns[tab, "b" -> (#b^2&)]ConstructColumns keeps only the listed columns:
ConstructColumns[tab, "b" -> Function[#b ^ 2]]TransformColumns can be used to remove columns:
tab = Tabular[{{1, 2}, {3, 4}, {5, 6}}, {"a", "b"}]TransformColumns[tab, "a" -> Nothing]Equivalently, use DeleteColumns:
DeleteColumns[tab, "a"]Take a Tabular object whose columns are years and months:
data = {{2024, 10}, {2024, 11}, {2024, 12}};tab = Tabular[data, {"year", "month"}]TransformColumns can add a new column by constructing a date for each row:
TransformColumns[tab, "date" -> DateObject @* Values]TransformColumns[tab, "date" -> (DateObject[{#year, #month}, "Month"]&)]Alternatively, first construct the column of dates and then use InsertColumns to append it:
InsertColumns[tab, "date" -> Map[DateObject, data]]Text
Wolfram Research (2025), TransformColumns, Wolfram Language function, https://reference.wolfram.com/language/ref/TransformColumns.html (updated 2026).
CMS
Wolfram Language. 2025. "TransformColumns." Wolfram Language & System Documentation Center. Wolfram Research. Last Modified 2026. https://reference.wolfram.com/language/ref/TransformColumns.html.
APA
Wolfram Language. (2025). TransformColumns. Wolfram Language & System Documentation Center. Retrieved from https://reference.wolfram.com/language/ref/TransformColumns.html