


EventSeries
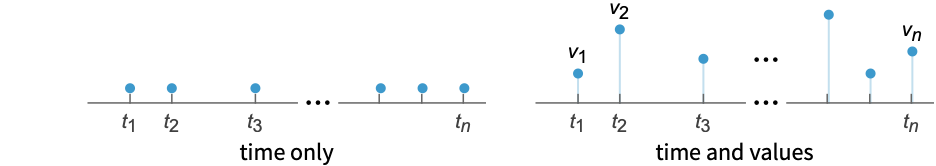
EventSeries[{{t1,v1},{t2,v2},…,{tn,vn}}]
represents a series of events at times ti with values vi.
EventSeries[tvspec]
uses the time-value specification tvspec.
EventSeries[vspec,tspec]
represents a event series with values given by vspec at times specified by tspec.
EventSeries[vspec,tspec,{com1,com2,…}]
specifies the event series component keys com1, com2, ….
Details and Options
- EventSeries represents a series of discrete events in time with possible component values for each event but no value assumed between data points.
- Event series are typically used to represent discrete events, and not something that gradually changes.
- Typical event series uses:
-
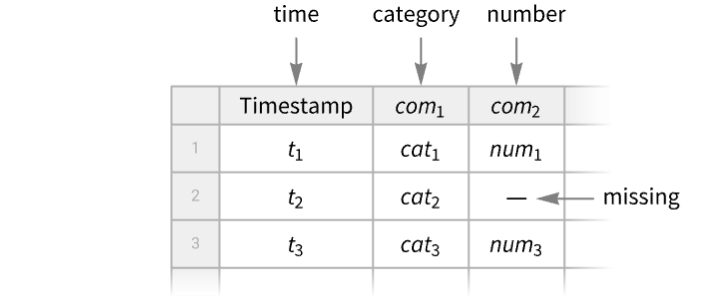
natural sunrise, eclipse, lighting, high tide, flooding, earthquake, ... social financial reversal, breakout, start of recession, traffic accident, crime event, war event, ... technical car passing, server call, page request, disk failure, ... medical getting sick, atrial defibrillation, arrhythmia, start of REM sleep, ... - An EventSeries object can always be viewed as a Tabular object with a "Timestamp" column and any number of component columns, and Tabular[EventSeries[…]] will convert to a Tabular object.
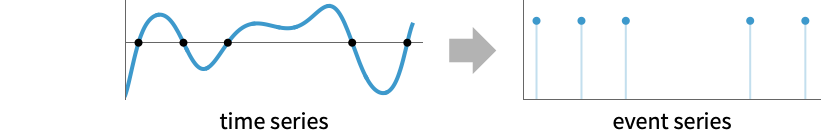
- You can get an EventSeries from a TimeSeries by finding events such as zero crossings, max crossings or other events, and TimeSeriesEvents provides such conversion.
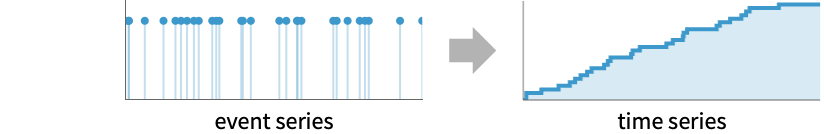
- You can derive a TimeSeries from an EventSeries by counting events, accumulating values or computing a local event rate, and EventSeriesAccumulate provides such conversion.
- The following time-value specifications tvspec can be given:
-
{{t1,v1},{t2,v2},…,{tn,vn}}, collection of time-value pairs timesvalues times and values separately Tabular[…] a Tabular object - The collection of time-value pairs does not need to be ordered in input, but it will be ordered automatically in output, forming a path.
- The following time specifications tspec can be given:
-
{{t1,t2,…,tn}} list of times 
{TabularColumn[…]} TabularColumn of times - Additionally, when values are present, timestamps can be computed automatically with these tspec:
-
Automatic  for
for  values
{tmin} 
{tmin,tmax}  for automatic
{tmin,Automatic,dt} 
- The ti, tmin and tmax can be numbers or DateObject instances. Then dt can be a number, a temporal Quantity or a day type, including "BusinessDay", "Weekday", "Weekend", "BeginningOfMonth", "EndOfMonth" or Monday through Sunday.
- The following value specifications vspec can be given:
-
{v1,v2,…,vn} list of values <"com1"{v11,v12,…},…> values {vi1,vi2,…} for component "comi" <> no values c constant value c for explicit timestamps Tabular[…], TabularColumn[…] Tabular or TabularColumn of values - For a time or event series tes, EventSeries[tes,options] returns an EventSeries object with the given options.
- Properties of an EventSeries object es can be obtained from es["property"].
- A list of available properties can be obtained using es["Properties"].
- Available timestamps properties include:
-
"Timestamps" TabularColumn of timestamps "FirstTimestamp" the first timestamp "LastTimestamp" the last timestamp "Dates" the timestamps as a list of DateObject "Times" the timestamps as a list of AbsoluteTime "FirstDate", "FirstTime" the first timestamp as DateObject or as AbsoluteTime "LastDate", "LastTime" the last timestamp as DateObject or as AbsoluteTime - Available values properties include:
-
"Values" the values as a Tabular or TabularColumn object "NormalValues" the values as a list {v1,…} "FirstValue" the value v1 at the first timestamp "LastValue" the value at the last timestamp "ValueType" the type of the values of a simple time series "ComponentKeys" the keys of the path components "ComponentTypes" the types of the path components - Available general properties include:
-
"Tabular" converts time series into a Tabular object "NormalPath" ordered timestamp-value pairs {{t1,v1},…} "Path" the path with timestamps as AbsoluteTime "DatePath" the path with timestamps as DateObject "PathLength" the length of the path "PathComponents" split the multivariate path into univariate components "PathFunction" the original time series object as a function of time - Normal[es] is equivalent to es["NormalPath"].
- EventSeries takes the following options:
-
ComponentKeys Automatic the keys for the path components CalendarType Automatic the calendar type to use DateGranularity Automatic the granularity of calendar timestamps HolidayCalendar Automatic the holiday calendar to use TimeZone Automatic the time zone to use DateFunction Automatic how to convert dates to standard form MergingFunction Automatic how to merge values of duplicate timestamps MetaInformation <> include additional metainformation MissingDataMethod None method to use for missing values TemporalRegularity Automatic whether to assume the data is regular TimeObservationWindow Automatic specify the temporal region for the timestamps ValueDimensions Automatic the dimensions of the values - The setting ValueDimensions->dim specifies that the values vij are of dimension dim.
Examples
open all close allBasic Examples (3)
Create an event series of temporal events:
events = {DateObject[{2022, 1, 1}], DateObject[{2022, 1, 13}], DateObject[{2022, 2, 17}], DateObject[{2022, 3, 2}]};es = EventSeries[<||>, {events}]es["Timestamps"]//NormalTimelinePlot[%, PlotRange -> All]Create an event series with values:
times = {1, 2, 5, 12};
vals = {"a", "b", "c", "d"};es = EventSeries[vals, {times}]Normal[es]Create an event series with two components "a" and "b":
es = EventSeries[{{.1, "cat"}, {.2, "dog"}, {.3, "fox"}}, {{Yesterday, Today, Tomorrow}}, {"a", "b"}]Find the component values on a given date:
es[Today]es["Values"]Extract path of time-value pairs:
Normal[es]Scope (24)
Creation (6)
Create an event series from time-value pairs:
EventSeries[{{DateObject[{2025, 1, 3}, "Day"], 0.1}, {DateObject[{2025, 1, 10}, "Day"], 0.5}, {DateObject[{2025, 1, 12}, "Day"], 0.3}}]EventSeries[{DateObject[{2025, 1, 3}, "Day"] -> 0.1, DateObject[{2025, 1, 10}, "Day"] -> 0.5, DateObject[{2025, 1, 12}, "Day"] -> 0.3}]EventSeries[<|DateObject[{2025, 1, 3}, "Day"] -> 0.1, DateObject[{2025, 1, 10}, "Day"] -> 0.5, DateObject[{2025, 1, 12}, "Day"] -> 0.3|>]Create an event series from values and times:
EventSeries[{{0.1, "cat"}, {0.5, "dog"}, {0.3, "fox"}}, {{Yesterday, Today, Tomorrow}}]Specify keys for the value components:
EventSeries[{{.1, "cat"}, {.2, "dog"}, {.3, "fox"}}, {{Yesterday, Today, Tomorrow}}, {"a", "b"}]Specify value keys with an option:
EventSeries[{{.1, "cat"}, {.2, "dog"}, {.3, "fox"}}, {{Yesterday, Today, Tomorrow}}, ComponentKeys -> {"a", "b"}]Use iterator to specify timestamps:
EventSeries[{"cat", "dog", "fox", "cow"}, {Yesterday, Automatic, Quantity[2, "Weeks"]}]%//NormalEventSeries[{{.1, "cat"}, {.2, "dog"}, {.3, "fox"}}, {Yesterday, Automatic, Quantity[2, "Weeks"]}, {"a", "b"}]Create an event series given a starting time:
vals = {19, 16, 9, 3, 7, 2};EventSeries[vals, {10}]Normal[%]Create an event series given starting and ending times:
vals = {19, 16, 9, 3, 7, 2};EventSeries[vals, {10, 50}]Normal[%]s = {19, 16, 9, 3, 7, 2, 17, 10, 6, 12};es = EventSeries[s, {"2001", "2010"}]MinimumTimeIncrement[es]DateListPlot[es, Filling -> Axis, Joined -> False]Extraction (3)
Extract values from an event series:
es = EventSeries[RandomDate[3] -> {{0.1, "cat"}, {0.2, "dog"}, {0.3, "fox"}}, ComponentKeys -> {"a", "b"}]es["Values"]Select single value component:
es[[All, "a"]]Values[%]Normal[%]Single value component tabular:
es[[All, {"a"}]]Values[%]Select multiple value components:
es[[All, {"b", "a"}]]Create an event series with values given as a Tabular object:
ToTabular[{"a" -> {.1, .2, .3}, "b" -> {"cat", "dog", "fox"}}, "Columns"]es = EventSeries[%, {RandomDate[3, DateGranularity -> "Day"]}]es["Timestamps"]Normal[%]Get the type information for the timestamps:
es["Timestamps"]["ElementType"]Extract a subevent series for a given temporal window:
es = EventSeries[{RGBColor[0.803921568627451, 0.30980392156862746, 0.07058823529411765], RGBColor[1., 0.7254901960784313, 0.09411764705882353], RGBColor[0.9568627450980393, 0.796078431372549, 0.13725490196078433], RGBColor[0.9529411764705882, 0.9803921568627451, 0.5725490196078431], RGBColor[0.4117647058823529, 0.592156862745098, 0.4], RGBColor[0.30980392156862746, 0.47058823529411764, 0.34509803921568627], RGBColor[0.2980392156862745, 0.28627450980392155, 0.5490196078431373], RGBColor[0.27058823529411763, 0.1843137254901961, 0.3764705882352941], RGBColor[0.8784313725490196, 0.10196078431372549, 0.20784313725490197], RGBColor[0.8, 0.058823529411764705, 0.07450980392156863]}, {DateObject[{2025, 1, 1}]}]TimeSeriesWindow[es, {DateObject[{2025, 1, 3}], DateObject[{2025, 1, 7}]}]Normal[%]Basic Uses (3)
Use TimeSeriesInsert to insert a missing value:
es = EventSeries[{7, 10, 17, 22, Missing[], 34, 35, 36, 44, 46}, {1}];es[5]ins = TimeSeriesInsert[es, {5, 27}];ins[5]ListPlot[#, Filling -> Axis]& /@ {es, ins}Use TimeSeriesRescale to rescale an event series to run from 0 to 20:
es = EventSeries[{{0, 3}, {1, 5}, {2, 7}, {3, 2}, {4, 5}}];rs = TimeSeriesRescale[es, {0, 20}];ListPlot[#, Filling -> Axis]& /@ {es, rs}Use TimeSeriesShift to shift the series ahead by 2:
sh = TimeSeriesShift[es, 2];ListPlot[{es, sh}, Filling -> Axis]Compute the differences between two event series:
es1 = EventSeries[{11, 12, 13}, {0}];
es2 = EventSeries[{14, 15, 16}, {0}];es1 - es2%//NormalUse TimeSeriesThread to compute maximum event series:
TimeSeriesThread[Max@@#&, {es1, es2}];%//NormalEventSeries with Values (6)
Visualize an event series with values:
v = {3, 8, 4, 11, 9, 2};
t = {1, 3, 5, 7, 8, 10};ListPlot[EventSeries[v, {t}], Filling -> Axis]Provide values as a Tabular object:
times = {.1, .5, 1, 2};
data = Tabular[Association["RawSchema" -> Association["ColumnProperties" ->
     Association["a1" -> Association["ElementType" -> "Integer64"],
      "a2" -> Association["ElementType" -> "InertExpression"]], "KeyColumns" -> None,
    "Backend" -> "WolframKernel"], "BackendData" ->
   Association["ColumnData" -> DataStructure["ColumnTable",
      {{TabularColumn[Association["Data" -> {{1, 2, 3, 1}, {}, None}, "ElementType" ->
           "Integer64"]], TabularColumn[Association["Data" -> {{a, b,
             c, d}, {}, None}, "ElementType" -> "InertExpression",
          "CachedOriginalExpression" -> {a, b, c,
d}]]}}]]]];es = EventSeries[times -> data]es["Values"]Numerical, listable functions automatically thread over values of event series:
es = EventSeries[{3, 4, 2, 7, 8, 5, 10}]Sin[es + 1]Normal[%]Square the values of an event series:
es ^ 2Normal[%]Combining several event series with identical time stamps threads over values:
EventSeries[{{1, Subscript[x, 1]}, {2, Subscript[x, 2]}, {3, Subscript[x, 3]}}] + EventSeries[{{1, Subscript[y, 1]}, {2, Subscript[y, 2]}, {3, Subscript[y, 3]}}]%//NormalUse TimeSeriesThread to compute maximum values between two event series:
es1 = EventSeries[{a, b, c}, {{0, 1, 2}}];
es2 = EventSeries[{d, e, f}, {{0, 1, 2}}];TimeSeriesThread[Max, {es1, es2}]%//NormalAggregate events in time windows:
es = EventSeries[TimeEventSeries`TimestampData[Association["UniformlySpacedQ" -> True, "Count" -> 100,
   "Endpoints" -> TabularColumn[Association["Data" -> {{0, 99}, {}, None},
      "ElementType" -> "Integer64"]], "MinimumTimeIncrement" -> 1, "Calle ... , 1, 0, 0, 0, 1, 1, 1, 0, 0, 0, 0, 0, 0, 1, 1, 0, 1, 0, 0, 1, 0, 1, 0, 1, 1, 1,
      0, 0, 1, 1, 1, 0, 0, 1, 1, 1, 1, 1, 0, 0, 0, 1, 1, 0}, {}, None},
"ElementType" -> "Integer64"]], Association["TimeObservationWindow" -> Interval[{0, 99}]]];tot = TimeSeriesAggregate[es, 10, Total]ListLinePlot[{es, tot}, Joined -> {False, True}, InterpolationOrder -> 0, Filling -> {1 -> 0}, PlotRange -> All]Component Keys (6)
EventSeries[{{.1, "cat"}, {.2, "dog"}, {.3, "fox"}}, {{Yesterday, Today, Tomorrow}}, {"a", "b"}]Show the data using conversion to Tabular:
Tabular[%]Component keys are added automatically when the given list is incomplete:
EventSeries[{{.1, "cat"}, {.2, "dog"}, {.3, "fox"}}, {{Yesterday, Today, Tomorrow}}, {"number"}]ColumnKeys[%]Generate all component keys by giving {}:
EventSeries[{{.1, "cat"}, {.2, "dog"}, {.3, "fox"}}, {{Yesterday, Today, Tomorrow}}, {}]ColumnKeys[%]The Automatic value of component keys argument preserves the input keys:
tab = Tabular[Association["RawSchema" -> Association["ColumnProperties" ->
     Association["K1" -> Association["ElementType" -> "Real64"],
      "K2" -> Association["ElementType" -> "String"]], "KeyColumns" -> None,
    "Backend" -> "WolframKernel"], "Options" -> {},
  "BackendData" -> Association["ColumnData" -> DataStructure["ColumnTable",
      {{TabularColumn[Association["Data" -> {{0.1, 0.2, 0.3}, {}, None},
          "ElementType" -> "Real64"]], TabularColumn[Association[
"Data" -> {{3, {0, 3, 6, 9}, "catdogfox"}, {}, None}, "ElementType" -> "String"]]}}]]]];EventSeries[tab, {{Yesterday, Today, Tomorrow}}, Automatic]Tabular[%]When component keys are given, they override the input keys:
tab = Tabular[Association["RawSchema" -> Association["ColumnProperties" ->
     Association["K1" -> Association["ElementType" -> "Real64"],
      "K2" -> Association["ElementType" -> "String"]], "KeyColumns" -> None,
    "Backend" -> "WolframKernel"], "Options" -> {},
  "BackendData" -> Association["ColumnData" -> DataStructure["ColumnTable",
      {{TabularColumn[Association["Data" -> {{0.1, 0.2, 0.3}, {}, None},
          "ElementType" -> "Real64"]], TabularColumn[Association[
"Data" -> {{3, {0, 3, 6, 9}, "catdogfox"}, {}, None}, "ElementType" -> "String"]]}}]]]];EventSeries[tab, {{Yesterday, Today, Tomorrow}}, {"a", "b"}]Tabular[%]With component keys value None, the output event series is simple, without explicit components:
tab = Tabular[Association["RawSchema" -> Association["ColumnProperties" ->
     Association["K1" -> Association["ElementType" -> "Real64"],
      "K2" -> Association["ElementType" -> "String"]], "KeyColumns" -> None,
    "Backend" -> "WolframKernel"], "Options" -> {},
  "BackendData" -> Association["ColumnData" -> DataStructure["ColumnTable",
      {{TabularColumn[Association["Data" -> {{0.1, 0.2, 0.3}, {}, None},
          "ElementType" -> "Real64"]], TabularColumn[Association[
"Data" -> {{3, {0, 3, 6, 9}, "catdogfox"}, {}, None}, "ElementType" -> "String"]]}}]]]];EventSeries[tab, {{Yesterday, Today, Tomorrow}}, None]Tabular[%]When there are no input keys, the Automatic value will preserve the simple component input:
EventSeries[{{.1, "cat"}, {.2, "dog"}, {.3, "fox"}}, {{Yesterday, Today, Tomorrow}}, Automatic]Tabular[%]Options (12)
CalendarType (1)
Specify time stamps as dates in a specific calendar using CalendarType:
EventSeries[Range[5], {{2014, 2, 14}, Automatic, "Day"}, CalendarType -> "Jewish"]By default, the "Gregorian" calendar is being used:
EventSeries[Range[5], {{2014, 2, 14}, Automatic, "Day"}]Component Keys (1)
By default, data without explicit components results in a simple event series:
EventSeries[{{.1, "cat"}, {.2, "dog"}, {.3, "fox"}}, {{Yesterday, Today, Tomorrow}}]Show the data using conversion to Tabular:
Tabular[%]Construct an event series with component keys "a" and "b":
EventSeries[{{.1, "cat"}, {.2, "dog"}, {.3, "fox"}}, {{Yesterday, Today, Tomorrow}}, ComponentKeys -> {"a", "b"}]Tabular[%]DateFunction (2)
By default, the date granularity is inferred from the input timestamps:
EventSeries[Range[3], {Today}]%["Timestamps"]["ElementType"]Use DateFunction to convert the granularity of the input timestamps:
TimeSeries[Range[3], {Today}, DateFunction -> Function[DateObject[#, "Year"]]]%["Timestamps"]["ElementType"]Use DateList to define functions for interpreting ambiguous date strings:
data = {{"06/01/06", 8}, {"07/01/06", 10}, {"08/01/06", 12}, {"09/01/06", 14}, {"10/01/06", 15}, {"11/01/06", 20}};EventSeries[data, DateFunction :> (DateList[{#, {"Month", "Day", "YearShort"}}]&)]EventSeries[data, DateFunction :> (DateList[{#, {"Day", "Month", "YearShort"}}]&)]EventSeries[data, DateFunction :> (DateList[{#, {"YearShort", "Month", "Day"}}]&)]DateGranularity (1)
Compute an event series of eclipse types for five random dates in the last 100 years:
RandomDate[Quantity[-100, "Years"], 5]es = SolarEclipse[%, "Type"]The timestamps were stored with "Instant" granularity:
Normal[es]Change the timestamps to have "Day" granularity:
EventSeries[es, DateGranularity -> "Day"]Normal[%]HolidayCalendar (1)
Use HolidayCalendar to visualize business days in a given country:
EventSeries[ConstantArray[1, 40], {{2025, 11, 1}, Automatic, "BusinessDay"}, HolidayCalendar -> "UnitedStates"]DateListPlot[%, Joined -> False, Filling -> Axis]MergingFunction (1)
By default, the duplicate timestamps are not merged during creation of an EventSeries:
times = {0.2, 0.5, 0.5, 0.9, 1.2};
vals = Range[Length[times]];EventSeries[vals, {times}]//NormalSpecify how to combine values from the duplicate timestamps:
EventSeries[vals, {times}, MergingFunction -> Total]//NormalMetaInformation (1)
MissingDataMethod (1)
Take an event series with missing values:
missd = {2, 1, 3, Missing[], 2, 1, 2, Missing[], 6, 2, 5};es = EventSeries[missd, Automatic]Normal[es]Use MissingDataMethod to replace missing values with a constant:
EventSeries[missd, MissingDataMethod -> {"Constant", c}]Normal[%]Replace the missing values with a mean of non-missing values:
EventSeries[missd, MissingDataMethod -> "Mean"]Normal[%]TemporalRegularity (1)
TimeObservationWindow (1)
By default, the time observation window is inferred from the range of the timestamps:
times = {.2, .3, .5, .8};EventSeries[<||>, {times}]%["TimeObservationWindow"]Specify a different time observation window:
EventSeries[<||>, {times}, TimeObservationWindow -> Interval[{0, 1}]]%["TimeObservationWindow"]TimeZone (1)
Specify the time zone of EventSeries:
es = EventSeries[{1, 2, 3}, {Yesterday}, TimeZone -> -3]es["Dates"]es["TimeZone"]Applications (5)
Notable Dates (1)
The event series of birthdays of American presidents (as of 2025):
es = EventSeries[TimeEventSeries`TimestampData[Association["UniformlySpacedQ" -> False,
   "Timestamps" -> TabularColumn[Association[
      "Data" -> {45, {{NumericArray[{-86876, -85530, -82808, -79914, -77314, -74071, -73953,
           -71913, -6832 ... Dwight D. EisenhowerLyndon B. JohnsonRonald ReaganRichard M. NixonGerald FordJohn F. \
KennedyGeorge H.W. BushJimmy CarterJoseph R. BidenDonald TrumpGeorge W. BushBill ClintonBarack \
Obama"}, {}, None}, "ElementType" -> "String"]], Association[]];TimelinePlot[es["Timestamps"]]Use AssociationThread to plot dates with names:
TimelinePlot[AssociationThread[es["Values"] -> es["Timestamps"]]]Birthday distribution within a year:
DateHistogram[es["Timestamps"], "Month", DateReduction -> "Year"]birthdays = Transpose[{es["Values"], Map[DateValue[#, {"Month", "Day"}]&, es["Timestamps"]]}];Select[GatherBy[birthdays, Last], Length[#] > 1&]Earthquakes (1)
Event series of earthquake magnitudes with magnitude at least 6:
es = EventSeries[TimeEventSeries`TimestampData[Association["UniformlySpacedQ" -> False,
   "Timestamps" -> TabularColumn[Association[
      "Data" -> {57, {{{1420607228000, 1420607235000, 1421984847000, 1422413000000, 1422874189000,
           1423681 ...
    39, 40, 41, 42, 43, 44, 45, 46, 47, 48, 49, 50, 51, 52, 53, 55, 56, 57, 58, 59, 60, 61},
  "TimeObservationWindow" -> DateInterval[{{{2015, 1, 6, 23, 7, 8.}, {2015, 5, 15, 14, 26, 55.}}},
"Instant", "Gregorian", -6., "UT", Automatic]]];DateListPlot[es, Filling -> 0, Joined -> False]Show the distributions of the magnitudes:
Histogram[es, {"Log", {5.75, 10, 0.25}}, ScalingFunctions -> "Log"]Find the conditional probability of a magnitude 7 or greater earthquake in the given time interval:
NProbability[m ≥ 7., mes["Values"]]Fitness (1)
Compare cumulative totals of the daily number of steps with geographical reference points from Champaign, IL:
stepdata = EventSeries[TimeEventSeries`TimestampData[Association["UniformlySpacedQ" -> True, "Count" -> 91,
   "Endpoints" -> TabularColumn[Association[
      "Data" -> {2, {{{1388556000000, 1396332000000}, {}, None}}, None},
      "ElementType" -> "Date"[" ... }, None}, "ElementType" -> TypeSpecifier["Quantity"]["Integer64", "StepsLength"]]],
 Association["TimeObservationWindow" -> DateInterval[
    {{{2014, 1, 1, 0, 0, 0.}, {2014, 4, 1, 0, 0, 0.}}}, "Instant", "Gregorian", -6., "UT",
    Automatic]]];
Accumulate the event series and convert to distance units:
avgstep = Mean@MinMax[Quantity[Interval[{68.96, 97.44}], "Centimeters" / QuantityUnit[stepdata["FirstValue"]]]]cumulative = EventSeriesAccumulate[stepdata -> "Value"] * avgstepUnitConvert[cumulative["LastValue"], "Miles"]Calculate distances to a few cities within the maximum distance:
distances = (EntityValue[#, "Name"] -> GeoDistance[#, Entity["City", {"Champaign", "Illinois", "UnitedStates"}]])& /@ {Entity["City", {"Champaign", "Illinois", "UnitedStates"}], Entity["City", {"Pittsburgh", "Pennsylvania", "UnitedStates"}], Entity["City", {"Columbus", "Ohio", "UnitedStates"}], Entity["City", {"Indianapolis", "Indiana", "UnitedStates"}]}The quantity values of the event series are given as a QuantityArray and need Normal:
crossingpoints = Sort[Table[dist[[1]] -> First[Flatten@Position[Normal[cumulative["Values"]], _ ? (# > dist[[2]]&), {1}, 1]], {dist, distances}], #2[[2]] > #1[[2]]&]Plot the cumulative number of steps with the distance marked by the cities:
DateListPlot[{cumulative, Callout[cumulative["Path"][[#[[2]]]], #[[1]], Above]& /@ crossingpoints}, Joined -> {True, False}, Filling -> Axis, TargetUnits -> "Miles", FrameLabel -> Automatic, PlotRangePadding -> {{Scaled[.1], Automatic}, {Automatic, Automatic}}, PlotLabel -> "Cumulative Distance Walked 2014"]Arrivals (1)
The number of patients arriving at an emergency room has been recorded for each hour from 1am to midnight:
arrivals = EventSeries[{7, 9, 10, 6, 4, 2, 1, 6, 3, 2, 14, 12, 17, 13, 14, 15, 14, 18, 15, 14, 15, 15, 10, 11}, {0, 23, 1}]ListPlot[arrivals, Filling -> Axis]Illustrate the 24-hour cycle to observe that fewer patients arrive late at night and in the early morning:
vals = arrivals["Values"];
hours = Table[Rotate[ToString[k] ~~ ":00", (90Sign[11.9 - k] - k * 360 / 24)Degree], {k, 0, 23}];SectorChart[Transpose[{ConstantArray[1, 24], vals}], SectorOrigin -> {{π / 2, -1}, 8}, ChartLabels -> Placed[hours, "RadialOutside"], ColorFunction -> Function[{angle, radius}, ColorData["Rainbow"][radius]]]Natural Phenomena (1)
Compute the instants of March equinox for 800 consecutive years:
FindAstroEvent["MarchEquinox", DateRange[DateObject@{1800}, {2599}, "Year"]]Find their days in March as reals with fractional day decimal parts:
es = TimeSeriesMap[DateValue[#, "DayExact"]&, %]March equinoxes happen on days 19, 20 or 21:
MinMax[es]The fractional part represents time of the day:
TimeObject[24FractionalPart[First[%]]]Show how they drift year to year and how leap days must be handled differently in cycles of 400 years:
DateListPlot[es, Joined -> False, FrameTicks -> {{{{19, "Mar 19 00:00"}, {19.5, "Mar 19 12:00"}, {20, "Mar 20 00:00"}, {20.5, "Mar 20 12:00"}, {21, "Mar 21 00:00"}, {21.5, "Mar 21 12:00"}}, None}, {Automatic, None}}]Properties & Relations (3)
Get information about an event series:
EventSeries[1, {{DateObject[{2022, 1, 1}], DateObject[{2022, 1, 13}], DateObject[{2022, 2, 17}], DateObject[{2022, 3, 2}]}}];Information[%]Extract properties from an event series:
es = EventSeries[{{1, a}, {2, b}, {3, c}, {1, d}}, {{.1, .5, 1, 2}}, {"c1", "c2"}]es["Properties"]es["Values"]es["ComponentKeys"]es["TimeObservationWindow"]es["Timestamps"]Normal[%]When extracting components, repeated components will be discarded since keys must be unique:
es = EventSeries[RandomDate[3] -> {{0.1, "cat"}, {0.2, "dog"}, {0.3, "fox"}}, ComponentKeys -> {"a", "b"}]es[[All, {"b", "a", "b"}]]%["Values"]Neat Examples (1)
Create a moon calendar for a month:
mp = MoonPhase[DateRange[DateObject[{2027, 3, 1}], DateObject[{2027, 3, 31}], {1, "Day"}], "Icon"]Labeled[Grid[Partition[Labeled[ImageResize[#2, {55, 50}], DateString[#, {"DayShort"}]]&@@@ mp["Path"], 7, 7, 4, ""], Frame -> All], DateString[mp["FirstTime"], {"MonthName", " ", "Year"}], Top]Text
Wolfram Research (2014), EventSeries, Wolfram Language function, https://reference.wolfram.com/language/ref/EventSeries.html (updated 2026).
CMS
Wolfram Language. 2014. "EventSeries." Wolfram Language & System Documentation Center. Wolfram Research. Last Modified 2026. https://reference.wolfram.com/language/ref/EventSeries.html.
APA
Wolfram Language. (2014). EventSeries. Wolfram Language & System Documentation Center. Retrieved from https://reference.wolfram.com/language/ref/EventSeries.html