

LinearGradientFilling
LinearGradientFilling[{col1,col2,…,coln}]
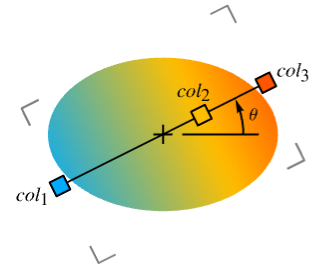
is a two-dimensional graphics directive specifying that faces of polygons and other filled graphics objects are to be drawn using a progressive transition between colors coli along a straight horizontal line.
LinearGradientFilling[{pos1,pos2,…,posn}{col1,col2,…,coln}]
uses the colors coli at the scaled positions posi.
LinearGradientFilling[{pos1,pos2,…,posn}{col1,col2,…,coln},dir]
draws along the straight line with a direction dir.
LinearGradientFilling[{pos1,…,posn}{col1,…,coln},dir,padding]
uses the specified padding when drawing beyond the boundary positions pos1 and posn.
Details
- LinearGradientFilling is also know as linear, horizontal, vertical or angular gradient.
- LinearGradientFilling is typically used to fill a region with a range of position-dependent colors.
- LinearGradientFilling[{col1,col2,…,coln}] specifies a progressive transition between coli along the x axis of the bounding box of a graphic object.
- LinearGradientFilling[] is effectively equivalent to LinearGradientFilling[{Black,White}].
- LinearGradientFilling["scheme"] uses the specified color scheme in ColorData.
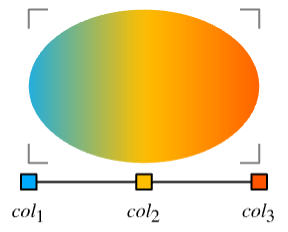
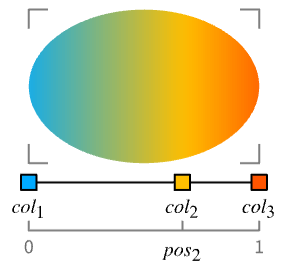
- LinearGradientFilling[{pos1,pos2,…,posn}{col1,col2,…,coln}] specifies colors coli to use at the scaled position posi taken to be relative to the width of the graphic object.
- ImageScaled can be used to specify the position posi and is taken to be fractions of the whole image region.
- LinearGradientFilling[{pos1col1,pos2col2,…}] is equivalent to LinearGradientFilling[{pos1,pos2,…}{col1,col2,…}].
- LinearGradientFilling[{{pos1,col1},{pos2,col2},…}] is equivalent to LinearGradientFilling[{pos1,pos2,…}{col1,col2,…}].
- With a numerical value θ, LinearGradientFilling[…,θ] specifies the straight line with angle θ and the orientation of the gradient in direction vector {Cos[θ],Sin[θ]}.
- Possible symbol directions dir in LinearGradientFilling[…,dir] include:
-
Bottom from top to bottom Center from bottom left to top right Left from right to left Right from left to right Top from bottom to top - LinearGradientFilling[colors] is effectively equivalent to LinearGradientFilling[colors,Right].
- LinearGradientFilling[{pos1,…,posn}{col1,…,coln},dir,padding] specifies the padding to use when drawing beyond the original range of positions between pos1 and posn.
- Possible settings for padding include:
-

"Fixed" repetitions of the colors 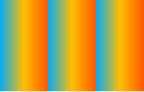
"Periodic" cyclic repetitions of all the colors 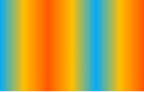
"Reflected" reflections of the colors - LinearGradientFilling[colors,dir] is effectively equivalent to LinearGradientFilling[colors,dir,"Fixed"].
Examples
open all close allBasic Examples (3)
Apply a linear gradient filling to a rectangle:
Graphics[{LinearGradientFilling[{Red, Blue}], Rectangle[]}]Fill from a curve to the axis:
Plot[2Sin[x] + x, {x, 0, 15}, FillingStyle -> LinearGradientFilling[{RGBColor[1., 0.71, 0.75], RGBColor[0.64, 182/255, 244/255]}, Top], Filling -> Bottom]A linear gradient filling of the US map:
GeoGraphics[{LinearGradientFilling[{RGBColor[0.8887337889338569, 0.6872652443890922, 0.7107936282493809, 1.], RGBColor[0.49023987591300533, 0.4876253828910493, 0.6209426339841682, 1.], RGBColor[0.9996537617780855, 0.9995675813955313, 0.9996214193107363, 1.], RGBColor[0.698039839063257, 0.1333301463795396, 0.20392133625241132, 1.]}], Polygon[["United States"]]}]Scope (15)
Basic Uses (6)
Apply gradient filling to graphics primitives:
Graphics[{LinearGradientFilling[{RGBColor[0.6705882352941176, 0.8627450980392157, 1.], RGBColor[0.011764705882352941, 0.5882352941176471, 1.]}], #}]& /@ {Triangle[], Disk[], Polygon[{{3, 1}, {9, 8}, {0, 5}, {9, 3}, {4, 9}}]}Apply gradient filling to a plot:
Plot[2Sin[x] + x, {x, 0, 15}, Filling -> Bottom, FillingStyle -> LinearGradientFilling[{RGBColor[0.6705882352941176, 0.8627450980392157, 1.], RGBColor[0.011764705882352941, 0.5882352941176471, 1.]}, Top]]Apply gradient filling to a chart:
BarChart[{1, 2, 3, 4}, ChartStyle -> LinearGradientFilling[{RGBColor[0.6705882352941176, 0.8627450980392157, 1.], RGBColor[0.011764705882352941, 0.5882352941176471, 1.]}, Top]]Region[Style[ImplicitRegion[y^2 < x (-1 + x^3), {x, y}], LinearGradientFilling[{RGBColor[0.6705882352941176, 0.8627450980392157, 1.], RGBColor[0.011764705882352941, 0.5882352941176471, 1.]}]]]GeoGraphics[{GeoStyling["OutlineMap", LinearGradientFilling[{RGBColor[0.6705882352941176, 0.8627450980392157, 1.], RGBColor[0.011764705882352941, 0.5882352941176471, 1.]}]], Polygon[["austria"]]}]LinearGradientFilling[{RGBColor[0.6705882352941176, 0.8627450980392157, 1.], RGBColor[0.011764705882352941, 0.5882352941176471, 1.]}]Specifications (9)
LinearGradientFilling with no arguments draws a progressive transition from Black to White:
Graphics[{LinearGradientFilling[], RegularPolygon[4]}]Graphics[{LinearGradientFilling[#], RegularPolygon[4]}] & /@ {{Black, LightGray}, {Red, Pink, LightRed}, {Purple, Blue, Green, Yellow, Orange, Red}}Specify the scaled position of each color:
Graphics[{LinearGradientFilling[# -> {Black, LightGray}], RegularPolygon[4]}]& /@ {{0, 1}, {0.25, 1}, {0.75, 1}}Scaled positions are taken to be relative to the width of the graphic objects:
Graphics[{LinearGradientFilling[{0, 1} -> {Black, White}], RegularPolygon[4], RegularPolygon[{1, 1}, 1, 4]}]Specify color positions by fractions of the whole image:
Graphics[{LinearGradientFilling[{ImageScaled[0], ImageScaled[1]} -> {Black, White}], RegularPolygon[4], RegularPolygon[{1, 1}, 1, 4]}]Use predefined color schemes from ColorData:
Graphics[{LinearGradientFilling[#], RegularPolygon[4]}]& /@ {"SunsetColors", "BlueGreenYellow", "DeepSeaColors"}Use LightDarkSwitched to specify different colors for light and dark modes:
graphic = Graphics[{LinearGradientFilling[{LightDarkSwitched[Blue, Red], LightDarkSwitched[Cyan, Pink]}], RegularPolygon[4]}];{LightModePane[graphic], DarkModePane[graphic]}Draw a linear gradient at an angle θ in radians:
Graphics[{LinearGradientFilling[{Black, White}, Pi / 4], RegularPolygon[4]}]Graphics[{LinearGradientFilling[{Black, White}, 90 Degree], RegularPolygon[4]}]Graphics[{LinearGradientFilling[{Black, White}, #], RegularPolygon[4]}] & /@ {Right, Left, Top, Bottom, Center}Specify what padding when drawing beyond the bounding positions:
Graphics[{LinearGradientFilling[ {0.4, 0.5, 0.6} -> {RGBColor[0., 2/3, 1.], RGBColor[1., 3/4, 0.], RGBColor[1., 1/3, 0.]}, Pi / 4, #], RegularPolygon[4]}] & /@ {"Fixed", "Periodic", "Reflected"}Applications (13)
Basic Applications (3)
Show gradient colors and their positions:
gradient[pos_ -> colors_] := Graphics[{LinearGradientFilling[pos -> colors], Polygon[{{0, 0}, {1, 0}, {1, 1}, {0, 1}}]}, GridLines -> {Thread[{pos, colors}], None}, GridLinesStyle -> Thick, AspectRatio -> .2]Progressive transition between colors at 0 and 1:
gradient[{0, 1} -> {RGBColor[0., 2/3, 1.], RGBColor[1., 3/4, 0.]}]gradient[{1 / 3, 2 / 3} -> {RGBColor[0., 2/3, 1.], RGBColor[1., 3/4, 0.]}]gradient[RandomReal[1, 2] -> {RGBColor[0., 2/3, 1.], RGBColor[1., 3/4, 0.]}]direction[colors_, dir_] :=
Graphics[{{LinearGradientFilling[colors, dir], Polygon[{{0, 0}, {1, 0}, {1, 1}, {0, 1}}]}, {Thickness[Large], Arrowheads[{{.125, 1 / 2}}], Rotate[Arrow[{{0.01, 0.5}, {0.99, 0.5}}], dir, {0.5, 0.5}]}}]direction[{RGBColor[0., 2/3, 1.], RGBColor[1., 3/4, 0.]}, #] & /@ {0, Pi / 4, 3Pi / 4, Pi}Show gradient colors and padding:
gradient[pos_ -> colors_, padding_] := Graphics[{LinearGradientFilling[pos -> colors, padding], Polygon[{{0, 0}, {1, 0}, {1, 1}, {0, 1}}]}, GridLines -> {Thread[{pos, colors}], None}, GridLinesStyle -> Thick, AspectRatio -> .2]gradient[{1 / 3, 2 / 3} -> {RGBColor[0., 2/3, 1.], RGBColor[1., 3/4, 0.]}, "Fixed"]gradient[{1 / 3, 2 / 3} -> {RGBColor[0., 2/3, 1.], RGBColor[1., 3/4, 0.]}, "Periodic"]gradient[{1 / 3, 2 / 3} -> {RGBColor[0., 2/3, 1.], RGBColor[1., 3/4, 0.]}, "Reflected"]Gradient Colors (3)
Collection of gradient colors in ColorData:
ColorData["Gradients"]//Shortdisplay[scheme_] := Graphics[{LinearGradientFilling[scheme], Rectangle[RoundingRadius -> .1]}]display /@ Take[ColorData["Gradients"], -30]Collection of gradient colors in the Wolfram Data Repository:
uigradients = ResourceData["UI Color Gradients"];Keys[uigradients]//Shortdisplay[name_ -> color_] := Graphics[{LinearGradientFilling[color], Rectangle[RoundingRadius -> .1]}]display /@ Normal[Take[uigradients, 60]]Collection of hue colors in the Wolfram Data Repository:
hues = ResourceData["Hue Color Gradients"];hues//Shortdisplay[color_] := Graphics[{LinearGradientFilling[color], Rectangle[RoundingRadius -> .1]}]display /@ huesGraphics (3)
Apply gradient fillings to graphics primitives:
Graphics[{LinearGradientFilling[{RGBColor[0.6705882352941176, 0.8627450980392157, 1.], RGBColor[0.011764705882352941, 0.5882352941176471, 1.]}], #}]& /@ {Triangle[], RegularPolygon[4], Polygon[{{3, 1}, {9, 8}, {0, 5}, {9, 3}, {4, 9}}]}Apply gradient fillings to Text:
text[str_] := BoundaryDiscretizeGraphics[Text[str], _Text];Graphics[{LinearGradientFilling[{ImageScaled[0], ImageScaled[1]} -> {RGBColor[0.996078431372549, 0.7568627450980392, 0.38823529411764707], RGBColor[0.8705882352941177, 0.2627450980392157, 0.07450980392156863]}], text[Style["Wolfram", Large, FontFamily -> "Brush Script MT"]]}]Add a gradient background to graphics objects:
background[g_, colors_, dir_ : 0] := Append[g, Prolog -> {LinearGradientFilling[ImageScaled /@ Range[0, 1, 1 / (Length[colors] - 1)] -> colors, dir], RectangleBox[ImageScaled[{0, 0}], ImageScaled[{1, 1}]]}]A graphics object with a gradient background:
background[Graphics[{Red, Disk[], Green, Rectangle[{0, 0}, {2, 2}], Blue, Disk[{2, 2}]}], {Blue, Green, Red}]background[GraphPlot[Table[i -> Mod[i ^ 2, 102], {i, 0, 102}]], {RGBColor[0.6705882352941176, 0.8627450980392157, 1.], RGBColor[0.011764705882352941, 0.5882352941176471, 1.]}]background[BarChart[Range[8], Axes -> False], {RGBColor[0.996078431372549, 0.7568627450980392, 0.38823529411764707], RGBColor[0.8705882352941177, 0.2627450980392157, 0.07450980392156863]}, Top]Visualization (4)
Plot with a background gradient:
Plot[Sin[Sqrt[2]x] + Sin[x], {x, 0, 10}, Prolog -> {LinearGradientFilling[{ImageScaled[0], ImageScaled[1]} -> {RGBColor[0.6705882352941176, 0.8627450980392157, 1.], RGBColor[0.011764705882352941, 0.5882352941176471, 1.]}], Rectangle[ImageScaled[{0, 0}], ImageScaled[{1, 1}]]}, ...]Plot[{Sin[x] + x / 2, Sin[x] + x}, {x, 0, 10}, Filling -> {1 -> {2}}, FillingStyle -> LinearGradientFilling[{RGBColor[1., 0.71, 0.75], RGBColor[0.64, 182/255, 244/255]}, Bottom]]BarChart[{1, 2, 3, 4, 5}, ChartStyle -> LinearGradientFilling[{Black, White}, Bottom]]DateListPlot[FinancialData["IBM", "Jan. 1, 2020"], Filling -> Bottom, FillingStyle -> LinearGradientFilling[{LightRed, Red}, Top]]Properties & Relations (5)
LinearGradientFilling uses the color space of the specified colors:
Graphics[{LinearGradientFilling[{RGBColor[1, 0, 0], RGBColor[0, 0, 1]}], Rectangle[]}]The linear gradient with colors in HSB color space:
Graphics[{LinearGradientFilling[{Hue[0], Hue[2 / 3]}], Rectangle[]}]Different colors can be given at a single position to generate hard stops:
Graphics[{LinearGradientFilling[{0, 1 / 2, 1 / 2, 1} -> {RGBColor[1, 0, 0], RGBColor[1, 1, 0], RGBColor[0, 1, 0], RGBColor[0, 0, 1]}], Rectangle[]}]LinearGradientImage returns an image with linear blend of colors:
LinearGradientImage[{RGBColor[0., 2/3, 1.], RGBColor[1., 3/4, 0.], RGBColor[1., 1/3, 0.]}, {100, 50}]Graphics[{LinearGradientFilling[{RGBColor[0., 2/3, 1.], RGBColor[1., 3/4, 0.], RGBColor[1., 1/3, 0.]}], Rectangle[]}]Use Blend to generate an array of blended colors:
Graphics[Raster[{Range[100] / 100}, ColorFunction -> (Blend[{{0, RGBColor[1, 0, 0]}, {(1/2), RGBColor[1, 1, 0]}, {1, RGBColor[0, 0, 1]}}, #]&)], AspectRatio -> .4]Graphics[{LinearGradientFilling[{0, 1 / 2, 1} -> {RGBColor[1, 0, 0], RGBColor[1, 1, 0], RGBColor[0, 0, 1]}], Rectangle[]}]VertexColors interpolate between colors:
Graphics[Polygon[{{0, 0}, {1, 0}, {1, 1}, {0, 1}}, VertexColors -> {RGBColor[1, 0, 0], RGBColor[0, 1, 0], RGBColor[0, 1, 0], RGBColor[1, 0, 0]}]]Graphics[{LinearGradientFilling[{RGBColor[1, 0, 0], RGBColor[0, 1, 0]}], Polygon[{{0, 0}, {1, 0}, {1, 1}, {0, 1}}]}]Possible Issues (2)
When colors are specified with the same color space, that space is used for interpolation:
{Graphics[{LinearGradientFilling[{RGBColor[1, 0, 0], RGBColor[0, 0, 1]}], Rectangle[]}] , Graphics[{LinearGradientFilling[{Hue[0], Hue[2 / 3]}], Rectangle[]}]}When colors are specified using different color spaces, interpolation happens in the color space of the first color:
{Graphics[{LinearGradientFilling[{RGBColor[1, 0, 0], Hue[2 / 3]}], Rectangle[]}] , Graphics[{LinearGradientFilling[{Hue[2 / 3], RGBColor[1, 0, 0]}], Rectangle[]}]}Grayscale color space is interpreted as RGB color space:
Graphics[{LinearGradientFilling[{GrayLevel[0.5], Red}], Rectangle[]}]Color directives are preceded by LinearGradientFilling:
Graphics[{LinearGradientFilling[], Red, Disk[]}]Text
Wolfram Research (2020), LinearGradientFilling, Wolfram Language function, https://reference.wolfram.com/language/ref/LinearGradientFilling.html.
CMS
Wolfram Language. 2020. "LinearGradientFilling." Wolfram Language & System Documentation Center. Wolfram Research. https://reference.wolfram.com/language/ref/LinearGradientFilling.html.
APA
Wolfram Language. (2020). LinearGradientFilling. Wolfram Language & System Documentation Center. Retrieved from https://reference.wolfram.com/language/ref/LinearGradientFilling.html