

Quartiles
Details
 is equivalent to the median. »
 is equivalent to the average of the medians of the
  and
and  smallest elements in data if
  is odd, and the median of the
  smallest elements if
  is even.
 is defined like
  , but with the largest rather than smallest elements.
- For MatrixQ data, the quartile is computed for each column vector with Quartiles[{{x1,y1,…},{x2,y2,…},…}] equivalent to {Quartiles[{x1,x2,…}],Quartiles[{y1,y2,…}]}. »
- For ArrayQ data, quartiles are equivalent to ArrayReduce[Quartiles,data,1]. »
- Quartiles[data] is equivalent to Quantile[data,{1,2,3}/4,{{1/2,0},{0,1}}]. »
- Quartiles[data,{{a,b},{c,d}}] is equivalent to Quantile[data,{1,2,3}/4,{{a,b},{c,d}}].
- Common choices of parameters {{a,b},{c,d}} include:
-
{{0,0},{1,0}} inverse empirical CDF {{0,0},{0,1}} linear interpolation (California method) {{1/2,0},{0,0}} element numbered closest to p n {{1/2,0},{0,1}} linear interpolation (hydrologist method; default) {{0,1},{0,1}} mean‐based estimate (Weibull method) {{1,-1},{0,1}} mode‐based estimate {{1/3,1/3},{0,1}} median‐based estimate {{3/8,1/4},{0,1}} normal distribution estimate - The default choice of parameters is {{1/2,0},{0,1}}. »
- The data can have the following additional forms and interpretations:
-
Association the values (the keys are ignored) » SparseArray as an array, equivalent to Normal[data] » QuantityArray quantities as an array » WeightedData based on the underlying EmpiricalDistribution » EventData based on the underlying SurvivalDistribution » TimeSeries, TemporalData, … vector or array of values (the time stamps ignored) » Image,Image3D RGB channel's values or grayscale intensity value » Audio amplitude values of all channels » DateObject, TimeObject list of dates or list of times » - Quartiles[dist] gives the list
 corresponding to Quantile[dist]. »
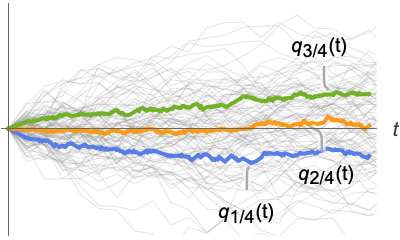
 - For a random process proc, the quartiles function can be computed for slice distribution at time t, SliceDistribution[proc,t], as Quartiles[SliceDistribution[proc,t]]. »
Examples
open all close allBasic Examples (3)
Scope (22)
Basic Uses (8)
Exact input yields exact output:
Quartiles[{1, 2, 3, 4}]Quartiles[{π, E, 2}]//TogetherApproximate input yields approximate output:
Quartiles[{1., 2., 3., 4.}]Quartiles[N[{1, 2, 3, 4}, 30]]Compute results using other parametrizations:
Quartiles[{-1, 5, 10, 4, 25, 2, 1}]Quartiles[{-1, 5, 10, 4, 25, 2, 1}, {{0, 0}, {1, 0}}]Find the quartiles of WeightedData:
Quartiles[WeightedData[{1, 2, 3}, {3, 7, 4}]]data = {8, 3, 5, 4, 9, 0, 4, 2, 2, 3};
weights = {0.15, 0.09, 0.12, 0.10, 0.16, 0., 0.11, 0.08, 0.08, 0.09};Quartiles[WeightedData[data, weights]]Find the quartiles of EventData:
e = {1.0, 2.1, 3.2, 4.5, 5.7};
ci = {0, 0, 0, 1, 0};Quartiles[EventData[e, ci]]Find the quartiles of TemporalData:
s1 = {2, 1, 6, 5, 7, 4};
s2 = {4, 7, 5, 6, 1, 2};
t = {1, 2, 5, 10, 12, 15};td = TemporalData[{s1, s2}, {t}];Quartiles[td[10]]Find the quartiles of TimeSeries:
Quartiles[TemporalData[TimeSeries, {{{2.3, 1.2, 6.7, 5.8, 7.1, 4.6}}, {{0, 5, 1}}, 1, {"Continuous", 1},
  {"Discrete", 1}, 1, {ResamplingMethod -> {"Interpolation", InterpolationOrder -> 1},
   ValueDimensions -> 1}}, False, 314.1]]
The quartiles depend only on the values:
Quartiles[TemporalData[TimeSeries, {{{2.3, 1.2, 6.7, 5.8, 7.1, 4.6}}, {{0, 5, 1}}, 1, {"Continuous", 1},
  {"Discrete", 1}, 1, {ResamplingMethod -> {"Interpolation", InterpolationOrder -> 1},
   ValueDimensions -> 1}}, False, 314.1]["Values"]]
Find the quartiles for data involving quantities:
data = Quantity[RandomReal[1, 6], "Meters"]Quartiles[data]Array Data (5)
Quartiles for a matrix gives columnwise quartiles:
Quartiles[{{1, 11, 3}, {4, 6, 7}}]Quartiles for a tensor gives columnwise medians at the first level:
Quartiles[{{{3, 7}, {2, 1}}, {{5, 19}, {12, 4}}}]Quartiles[RandomReal[1, {5, 3, 2}]]//TraditionalFormQuartiles[RandomReal[1, 10 ^ 7]]Quartiles[RandomReal[1, {10 ^ 6, 5}]]When the input is an Association, Quartiles works on its values:
mat = RandomReal[1, {3, 2}];
assoc = AssociationThread[Range[3], mat]Quartiles[assoc]SparseArray data can be used just like dense arrays:
Quartiles[SparseArray[{{1} -> 1, {100} -> 1}]]Quartiles[SparseArray[{{1, 1} -> 1, {2, 2} -> 2, {3, 3} -> 3, {1, 3} -> 4}]]Find quartiles of a QuantityArray:
data = QuantityArray[RandomReal[1, 6], "Pounds"]Quartiles[data]Image and Audio Data (2)
Channelwise quartile values of an RGB image:
Quartiles[[image]]Quartile intensity values of a grayscale image:
Quartiles[[image]]Quartile amplitudes of all channels:
a = ExampleData[{"Audio", "Bee"}]Quartiles[a]Date and Time (4)
dates = WolframLanguageData[All, "DateIntroduced"];DateHistogram[dates]Quartiles[dates]Compute the weighted quartiles of dates:
dates = RandomDate[4]weights = {1, 1, 1, 3};Quartiles[WeightedData[dates, weights]]Compute the quartiles of dates given in different calendars:
dates = {DateObject[{2024, 2, 29}, CalendarType -> "Julian"], DateObject[{1524, 1, 1}, CalendarType -> "Islamic"], DateObject[{6024, 1, 15}, CalendarType -> "Jewish"]}TimelinePlot[dates, ImageSize -> Medium]The mean is given in one of the input calendars:
Quartiles[dates]Compute the quartiles of times:
RandomTime[10]Quartiles[%]List of times with different time zone specifications:
{TimeObject[{12}, TimeZone -> 0], TimeObject[{12}, TimeZone -> 2], TimeObject[{12}, TimeZone -> "Asia/Tokyo"]}Quartiles[%]Distributions and Processes (3)
Find the quartiles for a parametric distribution:
Quartiles[NormalDistribution[μ, σ]]Quartiles for a derived distribution:
Quartiles[TransformedDistribution[x^2, xNormalDistribution[]]]data = RandomVariate[NormalDistribution[], 10 ^ 3];Quartiles[HistogramDistribution[data]]Quartile functions for a random process:
Quartiles[WienerProcess[][t]]Applications (4)
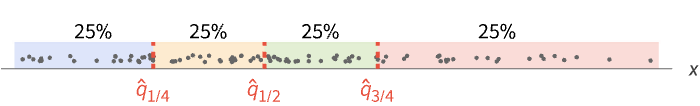
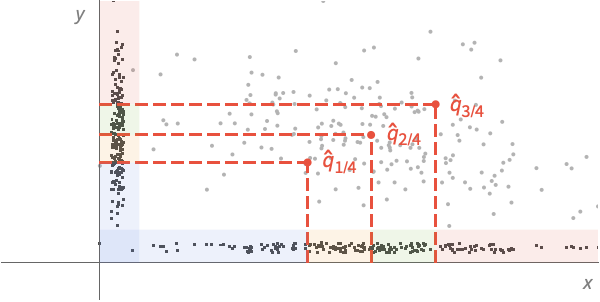
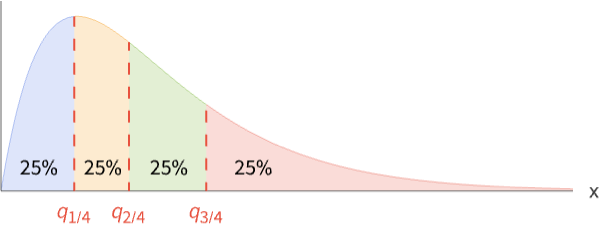
Quartiles divide a distribution in four equal probability sections:
𝒟 = ChiSquareDistribution[5];{m1, m2, m3} = Quartiles[𝒟];
{f1, f2, f3} = PDF[𝒟, {m1, m2, m3}];Plot[PDF[𝒟, x], {x, 0, 14}, Filling -> Axis, Epilog -> {Red, Dashed, Thick, Line[{{m1, 0}, {m1, f1}}], Line[{{m2, 0}, {m2, f2}}], Line[{{m3, 0}, {m3, f3}}]}]Find a moving quartile envelope for a time series:
SeedRandom[1234];
data = TimeSeries[Accumulate@RandomReal[{-5, 5}, 300]];q = MovingMap[Quartiles, data, Quantity[20, "Events"]];Data smoothed by moving median:
ListPlot[{data, q["PathComponent", 2]}, Joined -> {False, True}]Moving envelope of first and third quartiles:
ListPlot[{data, q["PathComponent", 1], q["PathComponent", 3]}, PlotStyle -> {Automatic, Gray, Gray}, Joined -> {False, True, True}, Filling -> {2 -> {3}}]Find the quartiles for data representing the top oil-producing fields in 2001:
data = ExampleData[{"Statistics", "TopOilFields2001"}][[All, 3]];ListPlot[data, PlotRange -> All]q = Quartiles[data]//NCompare with the minimum and maximum values for the data:
{min, max} = {Min[data], Max[data]}//NPlot the data with quartile lines:
n = Length[data];
{q1, q2, q3} = Table[{{0, q[[i]]}, {n, q[[i]]}}, {i, 1, 3}];
{m1, m2} = {{{0, min}, {n, min}}, {{0, max}, {n, max}}};ListLogPlot[{data, m1, q1, q2, q3, m2}, Joined -> {False, True, True, True, True, True}, Filling -> {3 -> min, 4 -> {3}, 5 -> {4}, 6 -> {5}}, PlotRange -> All, PlotLegends -> LineLegend[{"data", "min", "Q1", "median", "Q3", "max"}, LegendLayout -> "ReversedColumn"]]Compute the quartiles for the heights of children in a class:
heights = Quantity[{134, 143, 131, 140, 145, 136, 131, 136, 143, 136, 133, 145, 147,
150, 150, 146, 137, 143, 132, 142, 145, 136, 144, 135, 141}, "Centimeters"];ListPlot[heights, Filling -> Axis, AxesLabel -> Automatic]qrs = Quartiles[heights]//Nn = Length[heights];
ListPlot[Join[{heights}, Table[{{0, q}, {n, q}}, {q, qrs}]], Joined -> {False, True, True, True}, Filling -> {1 -> 0}, AxesLabel -> Automatic, PlotLegends -> {"heights", "Q1", "Q2 - median", "Q3"}]Properties & Relations (6)
Quartiles are given by linearly interpolated Quantile values:
list = {1, 2, 3, 5, 9, 10, 11, 12};
ps = {(1/4), (1/2), (3/4)};Quartiles[list]Quartiles[list] == Quantile[list, ps, {{1 / 2, 0}, {0, 1}}]The default parameters for Quantile give a different result:
Quantile[list, ps]The second quartile of the data is the Median:
data = RandomReal[10, 20];Quartiles[data][[2]]Median[data]The quantile of 1/2 does not average the two middle elements for lists of even length:
Quantile[data, 1 / 2]InterquartileRange is the difference between the first and third quartiles:
data = RandomReal[10, 20];Apply[Subtract, Quartiles[data][[{3, 1}]]]InterquartileRange[data]QuartileDeviation is half the difference between the first and third quartiles:
data = RandomReal[10, 20];Apply[Subtract, Quartiles[data][[{3, 1}]]] / 2QuartileDeviation[data]QuartileSkewness is a skewness measure obtained from the quartiles:
data = RandomReal[10, 20];{q1, q2, q3} = Quartiles[data](q1 - 2q2 + q3) / (q3 - q1)QuartileSkewness[data]BoxWhiskerChart shows the quartiles for data:
BoxWhiskerChart[RandomVariate[NormalDistribution[0, 1], 100]]Possible Issues (2)
Quartiles requires numeric values in data:
Quartiles[{a, b, c}]The symbolic closed form may exist for some distributions:
Quartiles[NormalDistribution[μ, σ]]Quartiles of data computed via Quantile do not always agree with Quartiles:
data = RandomReal[10, 20];res = Quartiles[data]res - Quantile[data, {1 / 4, 1 / 2, 3 / 4}]Specify linear interpolation parameters in Quantile:
res - Quantile[data, {1 / 4, 1 / 2, 3 / 4}, {{1 / 2, 0}, {0, 1}}]Text
Wolfram Research (2007), Quartiles, Wolfram Language function, https://reference.wolfram.com/language/ref/Quartiles.html (updated 2024).
CMS
Wolfram Language. 2007. "Quartiles." Wolfram Language & System Documentation Center. Wolfram Research. Last Modified 2024. https://reference.wolfram.com/language/ref/Quartiles.html.
APA
Wolfram Language. (2007). Quartiles. Wolfram Language & System Documentation Center. Retrieved from https://reference.wolfram.com/language/ref/Quartiles.html