

TimeSeriesThread
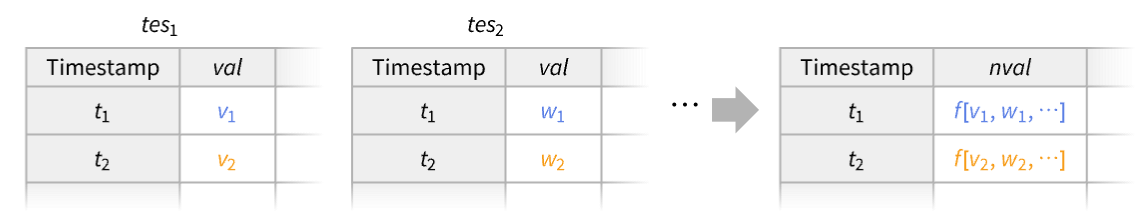
TimeSeriesThread[f,{tes1,tes2,…}]
combines the time or event series data tesi using the function f.
Details and Options
- TimeSeriesThread is typically used to combine the values of multiple time or event series.
- Possible forms of time or event series data tesi include:
-
TimeSeries[…] continuous time-ordered sampled data EventSeries[…] collection of temporal events with values TemporalData[…] one or more paths composed of time-value pairs {{t1,x1},{t2,x2},…} list of time-value pairs - The collection {tes1,tes2,…} can equivalently be given as TemporalData[{tes1,tes2,…}].
- For time series with components, use #[[i,"com"]] in the function f to use component "com" of tesi. »
- If the times for the tesi are not equivalent, each tesi is resampled using the union of all the times. »
- TimeSeriesThread takes the following option:
-
ResamplingMethod Automatic method to use for resampling paths - All of the tesi must contain the same number of paths. For multiple paths, TimeSeriesThread threads pathwise.
Examples
open all close allBasic Examples (4)
Obtain the sum of two time series:
ts1 = TimeSeries[{Subscript[x, 1], Subscript[x, 2], Subscript[x, 3], Subscript[x, 4], Subscript[x, 5]}, {1}];
ts2 = TimeSeries[{Subscript[y, 1], Subscript[y, 2], Subscript[y, 3], Subscript[y, 4], Subscript[y, 5]}, {1}];TimeSeriesThread[Total, {ts1, ts2}]//NormalInterpolation and extrapolation are used for misaligned time series:
ts1 = TimeSeries[{Subscript[x, 0], Subscript[x, 1], Subscript[x, 3]}, {{0, 1, 3}}];
ts2 = TimeSeries[{Subscript[y, 1], Subscript[y, 2], Subscript[y, 3]}, {{1, 2, 3}}];TimeSeriesThread[f, {ts1, ts2}]//Normal//SimplifyCompute the differences between two financial time series in 2025:
goog = FinancialData["GOOGL", {DateObject[{2025}]}];
appl = FinancialData["AAPL", {DateObject[{2025}]}];TimeSeriesThread[Apply[Subtract], {goog, appl}]DateListPlot[%]Combine time series with components:
ts1 = TimeSeries[Tabular[Association["RawSchema" -> Association["ColumnProperties" ->
     Association["a" -> Association["ElementType" -> "Integer64"],
      "b" -> Association["ElementType" -> "Integer64"]], "KeyColumns" -> None,
    "Backend" -> "WolframKernel"], "Options" -> {},
  "BackendData" -> Association["ColumnData" -> DataStructure["ColumnTable",
      {{TabularColumn[Association["Data" -> {{1, 2, 3}, {}, None}, "ElementType" -> "Integer64"]],
        TabularColumn[Association["Data" -> {{4, 5, 6}, {}, None}, "ElementType" ->
           "Integer64"]]}}]]]], {Today}];
ts2 = TimeSeries[Tabular[Association["RawSchema" -> Association["ColumnProperties" ->
     Association["a" -> Association["ElementType" -> "Integer64"],
      "b" -> Association["ElementType" -> "String"]], "KeyColumns" -> None,
    "Backend" -> "WolframKernel"], "Options" -> {},
  "BackendData" -> Association["ColumnData" -> DataStructure["ColumnTable",
      {{TabularColumn[Association["Data" -> {{11, 21, 31}, {}, None}, "ElementType" ->
           "Integer64"]], TabularColumn[Association["Data" -> {{3, {0, 3, 6, 9}, "catfoxdog"}, {},
None}, "ElementType" -> "String"]]}}]]]], {Today}];TimeSeriesThread[#[[1, "b"]] + #[[2, "a"]]&, {ts1, ts2}]//TabularScope (8)
Basic Uses (4)
Total 10 simulated BernoulliProcess paths:
td = RandomFunction[BernoulliProcess[1 / 4], {25}, 10];sum = TimeSeriesThread[Total, td];ListPlot[sum, Filling -> Axis]Compute the mean across components of a time series:
ts = TimeSeries[Tabular[Association["RawSchema" -> Association["ColumnProperties" ->
     Association["a" -> Association["ElementType" -> "Integer64"],
      "b" -> Association["ElementType" -> "Integer64"]], "KeyColumns" -> None,
    "Backend" -> "WolframKernel"], "Options" -> {},
  "BackendData" -> Association["ColumnData" -> DataStructure["ColumnTable",
      {{TabularColumn[Association["Data" -> {{1, 2, 3}, {}, None}, "ElementType" -> "Integer64"]],
        TabularColumn[Association["Data" -> {{4, 5, 6}, {}, None}, "ElementType" ->
"Integer64"]]}}]]]], {Today}]TimeSeriesThread[Mean @* First, {ts}]//NormalCompute a min-max envelope for some process paths:
data = RandomFunction[WienerProcess[], {0, 1, .01}, 10 ^ 3];max = TimeSeriesThread[Max, data];
min = TimeSeriesThread[Min, data];ListLinePlot[{max, min}, PlotLegends -> {"max", "min"}]Create a 95% confidence envelope for some process paths:
data = RandomFunction[WienerProcess[], {0, 1, .01}, 500];Compute a time series of means ![]() and standard deviations
and standard deviations ![]() :
:
μ = TimeSeriesThread[Mean, data];
σ = TimeSeriesThread[StandardDeviation, data];
A 95% confidence interval for a normal is given ![]() :
:
conf = TimeSeriesThread[{#[[1]] - 1.95#[[2]], #[[1]] + 1.95#[[2]]}&, {μ, σ}];Show[ListLinePlot[data, PlotStyle -> Opacity[.1]], ListLinePlot[conf, PlotStyle -> StandardGreen]]Data Types (4)
Obtain the sum of two time series given by time-value pairs:
ts1 = {{1, a}, {2, b}, {3, c}};
ts2 = {{1, d}, {2, e}, {3, f}};TimeSeriesThread[Total, {ts1, ts2}]Obtain the difference between two TimeSeries:
ts1 = TimeSeries[{Subscript[x, 1], Subscript[x, 2], Subscript[x, 3], Subscript[x, 4], Subscript[x, 5], Subscript[x, 6]}];
ts2 = TimeSeries[{Subscript[y, 1], Subscript[y, 2], Subscript[y, 3], Subscript[y, 4], Subscript[y, 5], Subscript[y, 6]}];TimeSeriesThread[Subtract@@#&, {ts1, ts2}]["Path"]Find the standard deviation of various paths in TemporalData:
data = RandomFunction[WienerProcess[], {0, 1, .001}, 100]ListLinePlot[data, PlotStyle -> Thin]TimeSeriesThread[StandardDeviation, data];ListLinePlot[%]Find the maximum values between two EventSeries:
es1 = TemporalData[EventSeries, {{{2, 1, 6, 5, 7, 4}}, {{{1, 2, 5, 10, 12, 15}}}, 1, {"Discrete", 1},
{"Discrete", 1}, 1, {ResamplingMethod -> None}}, False, 10.];es2 = TemporalData[EventSeries, {{{3, 2, 10, 4, 11, 7}}, {{{1, 2, 5, 10, 12, 15}}}, 1, {"Discrete", 1},
{"Discrete", 1}, 1, {ResamplingMethod -> None}}, False, 10.];max = TimeSeriesThread[Max, {es1, es2}];ListPlot[#, Filling -> Axis]& /@ {es1, es2, max}Options (1)
Resampling Method (1)
Combine two time series with mismatched times:
ts1 = TimeSeries[{1, 3, 5, 7, 9}, {1}];
ts2 = TimeSeries[{2, 3, 4, 5, 6}, {{1, 1.5, 3.5, 4, 5}}];int0 = TimeSeriesThread[Total, {ts1, ts2}, ResamplingMethod -> "Interpolation"];int0//Normalint1 = TimeSeriesThread[Total, {ts1, ts2}, ResamplingMethod -> {"Interpolation", InterpolationOrder -> 1}];int1//NormalListLinePlot[{int0, int1}, PlotLegends -> {"interpolation order 0", "interpolation order 1"}]Applications (4)
Find the average process path:
data = RandomFunction[WienerProcess[], {0, 1, .001}, 100];ListLinePlot[data, PlotStyle -> Thin]TimeSeriesThread[Mean, data];ListLinePlot[%]Simulate a jump-diffusion process:
tspec = {0, 3, .01};
jump = RandomFunction[PoissonProcess[3], tspec];
diff = RandomFunction[WienerProcess[1.9, 1], tspec];
data = TimeSeriesThread[Total, {jump, diff}];ListPlot[{data, jump, diff}, PlotStyle -> {Thick, Dashed, Dashed}, PlotLegends -> {"jump-diffusion", "jumps", "diffusion"}]Generate a time series of the Sun's position and the Moon's position over a period of two months:
sunpos = SunPosition[DateRange[Today - Quantity[2, "Months"], Today, {12, "Hour"}], CelestialSystem -> "Equatorial"]moonpos = MoonPosition[DateRange[Today - Quantity[2, "Months"], Today, {12, "Hour"}], CelestialSystem -> "Equatorial"]Define a function to compute the angular distance between two objects on a sphere:
AngularDistance[{ϕ1_, θ1_}, {ϕ2_, θ2_}] := InverseHaversine[Haversine[ϕ1 - ϕ2] + Cos[ϕ1]Cos[ϕ2]Haversine[θ1 - θ2]] / DegreeFind the time series for the angular distance between the Sun and the Moon:
angdist = TimeSeriesThread[AngularDistance[First[#], Last[#]]&, {sunpos, moonpos}]Visualize the angular distance:
DateListPlot[angdist]Study male unemployment in France:
MaleLaborForce = EntityValue[Entity["Country", "France"], EntityProperty["Country", "LaborForce", {"Date" -> All, "Gender" -> "Male"}]];Rates = EntityValue[Entity["Country", "France"], EntityProperty["Country", "UnemploymentRate", {"Date" -> All, "Gender" -> "Male"}]];Rates["Values"]MaleUnemploymentRate = QuantityMagnitude[Rates] / 100;MaleUnemploymentRate["Values"]Male unemployment is the corresponding fraction of the male labor force:
MaleUnemployment = TimeSeriesThread[Times@@#&, TimeSeriesResample[TemporalData[{MaleLaborForce, MaleUnemploymentRate}], "Intersection"]];DateListPlot[MaleUnemployment, FrameLabel -> Automatic]Properties & Relations (3)
It is possible to thread EventSeries and TimeSeries:
es = EventSeries[{Subscript[x, 1], Subscript[x, 2], Subscript[x, 3], Subscript[x, 4], Subscript[x, 5]}, {1}];
ts = TimeSeries[{Subscript[y, 1], Subscript[y, 2], Subscript[y, 3], Subscript[y, 4], Subscript[y, 5]}, {3}];TimeSeriesThread[f, {es, ts}]The type of the result is determined by the type of the first object:
TimeSeriesThread[f, {ts, es}]Compare TimeSeriesThread with TimeSeriesMap operating on a single time series:
ts = TimeSeries[{Subscript[x, 1], Subscript[x, 2], Subscript[x, 3], Subscript[x, 4], Subscript[x, 5]}, {1}];TimeSeriesThread[f, ts]["Path"]TimeSeriesMap[f, ts]["Path"]The values of TimeSeriesThread can be computed with MapThread if the time series are aligned:
ts1 = TimeSeries[{Subscript[x, 1], Subscript[x, 2], Subscript[x, 3], Subscript[x, 4], Subscript[x, 5]}, {3}];
ts2 = TimeSeries[{Subscript[y, 1], Subscript[y, 2], Subscript[y, 3], Subscript[y, 4], Subscript[y, 5]}, {3}];TimeSeriesThread[Apply[f], {ts1, ts2}]//Values//NormalMapThread[f, {Values[ts1], Values[ts2]}]Possible Issues (1)
When threading misaligned event series, the result may contain Missing:
es1 = EventSeries[{Subscript[x, 1], Subscript[x, 2], Subscript[x, 3], Subscript[x, 4], Subscript[x, 5]}, {1}];
es2 = EventSeries[{Subscript[y, 1], Subscript[y, 2], Subscript[y, 3], Subscript[y, 4], Subscript[y, 5]}, {3}];TimeSeriesThread[f, {es1, es2}]//NormalSpecify how to replace Missing with the ResamplingMethod option:
TimeSeriesThread[f, {es1, es2}, ResamplingMethod -> {"Constant", 0}]//NormalNeat Examples (1)
Create a lunar calendar in which the background color depends on the fraction of the Moon illumination:
dates = DateRange[DateObject[{2014, 1, 1, 12}], DateObject[{2014, 1, 31, 12}], 1];mp = MoonPhase[dates, "Icon"];
sf = MoonPhase[dates, "Fraction"];Create a new event series with vector values composed of icons and fractions:
phases = TimeSeriesThread[#&, {mp, sf}]Labeled[Grid[Partition[Framed[Labeled[ImageResize[First[#2], 45], DateString[#1, {"DayNameShort", " ", "DayShort"}]], Background -> Lighter[ColorData["StarryNightColors", Last[#2]], .3]] & @@@ phases["Path"], 7, 7, 4, ""], Frame -> All, Spacings -> {0, 0}], "January 2014", Top]Text
Wolfram Research (2014), TimeSeriesThread, Wolfram Language function, https://reference.wolfram.com/language/ref/TimeSeriesThread.html (updated 2026).
CMS
Wolfram Language. 2014. "TimeSeriesThread." Wolfram Language & System Documentation Center. Wolfram Research. Last Modified 2026. https://reference.wolfram.com/language/ref/TimeSeriesThread.html.
APA
Wolfram Language. (2014). TimeSeriesThread. Wolfram Language & System Documentation Center. Retrieved from https://reference.wolfram.com/language/ref/TimeSeriesThread.html