

PlotGrid
Details
- PlotGrid is used to arrange multiple plots for easier viewing.
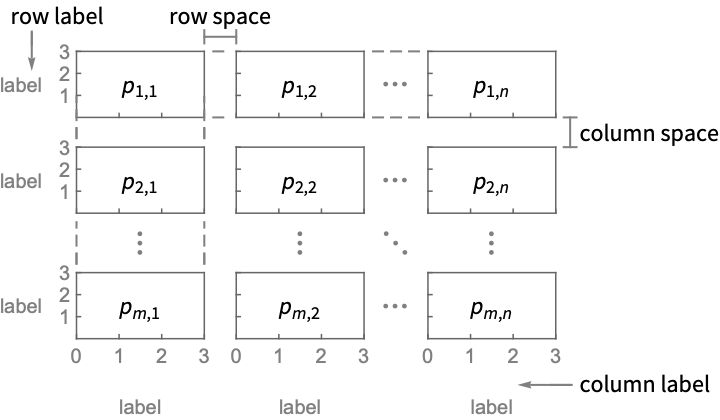
- PlotGrid aligns the array of plots pij such that plots in rows and columns share their
 and
and  scales.
 - Possible settings for shared that use the same scale for all rows or all columns to allow comparisons between any plots:
-
"AllRows" all rows have the same  scale, eg. all
  values can be compared
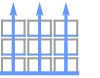
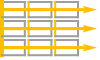
"AllColumns" all columns have the same  scale, eg. all
  values can be compared
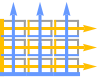
All,"AllRowsColumns" all rows and all columns have the same scales, eg. all  values and all
  values can be compared
 - Settings for shared that use the same scale for each row or each column to compare plots within a row or column:
-

"Rows" each row has the same  scale, eg.
  values in a row can be compared
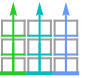
"Columns" each column has the same  scale, eg.
  values in a column can be compared
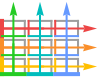
"RowsColumns" each row and each column has the same scale, eg.  values in a row and
  values in a column can be compared
 - Combined settings for shared can be the following form:
-

None no scales are shared 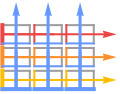
<"Rows"rows,"Columns"cols> use individual sharing settings for rows and columns - Possible sharing settings for rows and cols include:
-
All share scales for all rows or all columns Automatic share scales within each row or column None do not share scales within a row or column - The following wrappers w can be used for the pij:
-
Annotation[pij,label] provide an annotation for the pij Labeled[pij,label] label the plot Labeled[pij,label,pos] place the label at position pos Legended[pij,label] apply a legend to the plot Tooltip[pij,label] attach a tooltip to the plot - PlotGrid takes the same options as Graphics with the following additions and changes: [List of all options]
-
AspectRatio Automatic height to width ratio for the overall grid Axes False whether to show axes for each plot Background None background to use for the grid Dividers None where to draw divider lines in the grid Frame True whether to show frames for each plot ImageSize Automatic overall image size for the grid ItemAspectRatio Automatic aspect ratio for the individual plots ItemSize Automatic image size for the individual plots PlotLabel None overall label for the grid Spacings Automatic spacings between rows and columns - Spacings can take the following forms:
-
None no spacing between rows or columns Automatic default spacing between rows and columns sp spacing sp between rows and columns - The spacings sp are by default given in printer's points.
- A setting sp of the form Scaled[s] gives spacing that is a fraction s of the size of an item.
List of all options
Examples
open all close allBasic Examples (3)
Create a grid of plots in which every plot has the same ![]() scale and the same
scale and the same ![]() scale:
scale:
plots = Table[Plot[a Sin[x] + b, {x, 0, 2Pi}, Frame -> True], {a, 1, 2}, {b, 0, 1}]PlotGrid[plots]Use a shared ![]() scale for each row:
scale for each row:
PlotGrid[plots, "PerRow"]Include shared labels for the scales:
plots = Table[Plot[a Sin[x] + b, {x, 0, 2Pi}, Frame -> True, FrameLabel -> {"bottom", "left"}], {a, 1, 2}, {b, 0, 1}]PlotGrid[plots]Include individual labels for each plot:
plots = Table[Plot[a Sin[x] + b, {x, 0, 2Pi}, Frame -> True, FrameLabel -> {RandomWord[], RandomWord[]}], {a, 1, 2}, {b, 0, 1}]PlotGrid[plots, None]Options (13)
AspectRatio (3)
By default, the aspect ratio of the grid is determined by the contents:
PlotGrid[IconizedObject[«plots»]]The aspect ratios of the individual plots will be adjusted to fit the image size:
PlotGrid[IconizedObject[«plots»], ImageSize -> {300, 300}]Use an overall aspect ratio of 1/3:
PlotGrid[IconizedObject[«plots»], AspectRatio -> 1 / 3]Use ItemAspectRatio to control the ratio of the individual plots:
PlotGrid[IconizedObject[«plots»], ItemAspectRatio -> 1 / 3]ImageSize (5)
By default, the image size of the grid is determined by the contents:
PlotGrid[IconizedObject[«plots»]]The size of the individual plots will be adjusted to fit the image size:
PlotGrid[IconizedObject[«plots»], ImageSize -> {300, 300}]Specify the width of the grid:
PlotGrid[IconizedObject[«plots»], ImageSize -> 500]Specify the height of the grid:
PlotGrid[IconizedObject[«plots»], ImageSize -> {Automatic, 300}]Specify the width and height of the grid:
PlotGrid[IconizedObject[«plots»], ImageSize -> {500, 300}]Using fixed aspect ratios and image sizes may leave extra space around the grid:
PlotGrid[IconizedObject[«plots»], ItemAspectRatio -> 1, ImageSize -> {500, 300}]ItemAspectRatio (2)
Use ItemAspectRatio to control the ratio of the individual plots:
PlotGrid[IconizedObject[«plots»], ItemAspectRatio -> 1 / 3]PlotGrid[IconizedObject[«plots»], ItemAspectRatio -> 1]ItemSize (2)
Use ItemSize to control the width and height of the individual plots:
PlotGrid[IconizedObject[«plots»], ItemSize -> {100, 75}]Use plots that have a width of 100 and an automatic height:
PlotGrid[IconizedObject[«plots»], ItemSize -> 100]Use plots that have a height of 100 and an automatic width:
PlotGrid[IconizedObject[«plots»], ItemSize -> {Automatic, 100}]Spacings (1)
By default, a small amount of space is included between rows and columns:
PlotGrid[IconizedObject[«plots»], ImageSize -> 400]Use no spacing between rows and columns:
PlotGrid[IconizedObject[«plots»], ImageSize -> 400, Spacings -> None]Use 10 printer's points of spacing between rows and columns:
PlotGrid[IconizedObject[«plots»], ImageSize -> 400, Spacings -> 10]Text
Wolfram Research (2026), PlotGrid, Wolfram Language function, https://reference.wolfram.com/language/ref/PlotGrid.html.
CMS
Wolfram Language. 2026. "PlotGrid." Wolfram Language & System Documentation Center. Wolfram Research. https://reference.wolfram.com/language/ref/PlotGrid.html.
APA
Wolfram Language. (2026). PlotGrid. Wolfram Language & System Documentation Center. Retrieved from https://reference.wolfram.com/language/ref/PlotGrid.html