


TaggedNestGraph
TaggedNestGraph[f,expr,n]
gives the tagged edge graph obtained by starting with expr and applying f successively n times.
TaggedNestGraph[f,{expr1,expr2,…},n]
gives the graph obtained by applying f to expr1, expr2, ….
TaggedNestGraph[f,graph,n]
gives the graph obtained by applying f to the vertices of graph and extending the graph.
Details and Options
- TaggedNestGraph is also known as crawl graph or tree growing.
- TaggedNestGraph is typically used to iteratively construct a directed graph with edge tags automatically generated.
- TaggedNestGraph[f,expr,n] gives the directed graph made by starting with expr and applying f successively n times to create tagged edges directed from the input of f to its output. If that output is a list, then its elements are the destination vertices, with edges tagged based on the position of the destination vertex in that list. Tags are integers starting at 1.
- expr can be an expression or a list of expressions or graphs.
- TaggedNestGraph[f,expr] is equivalent to TaggedNestGraph[f,expr,1].
- TaggedNestGraph[f,expr] gives a graph with tagged edges {
 ,…,
,…, }, where f[expr] evaluates to {expr1,…,exprk}.
 - TaggedNestGraph[f,{expr1,expr2,…}] is the graph union of TaggedNestGraph[f,expr1] and TaggedNestGraph[f,expr2],….
- TaggedNestGraph[f,graph] is the union of graph and TaggedNestGraph[f,{v1,…}], where vi are the vertices of graph.
- TaggedNestGraph[f,graph,n] is the union of TaggedNestGraph[f,graph,n-1] and TaggedNestGraph[f,{v1,…}], where vi are the vertices of TaggedNestGraph[f,graph,n-1].
- TaggedNestGraph[f,expr,n] is equivalent to TaggedNestGraph[f,graph,n], where graph is the singleton graph with only one vertex expr and no edges.
- TaggedNestGraph takes the same options as Graph with the following additions and changes: [List of all options]
-
TaggedEdgeStyle Automatic style edges based on their tag DirectedEdges True whether the graph is directed or not
List of all options
Examples
open all close allBasic Examples (3)
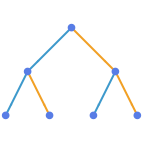
Construct a graph by starting with x and applying f successively 3 times:
TaggedNestGraph[f, x, 3, VertexLabels -> Automatic, EdgeLabels -> "EdgeTag"]Construct a graph by starting with x and applying functions f and g successively twice:
TaggedNestGraph[{f[#], g[#]}&, x, 2, VertexLabels -> Automatic, EdgeLabels -> "EdgeTag"]Iteratively find the five closest countries to a given country, starting with France:
TaggedNestGraph[GeoNearest["Country", #, 5]&, Entity["Country", "France"], 3, VertexLabels -> Automatic]Scope (3)
TaggedNestGraph works with any function including an expression:
TaggedNestGraph[f, x, 3]TaggedNestGraph[Mod[# ^ 2 + 1, 10]&, Range[0, 9], 2]TaggedNestGraph works with any expression including integers:
TaggedNestGraph[Mod[# ^ 2 + 1, 10]&, {1, 2, 3, 4, 5}, 2]TaggedNestGraph[WordData[#, "Synonyms", "List"] &, "tree", 2]TaggedNestGraph[WordData[#, "Synonyms", "List"] &, [image], 2]TaggedNestGraph[WordData[#, "Synonyms", "List"] &, "tree", 3]Options (83)
AnnotationRules (2)
Specify an annotation for vertices:
TaggedNestGraph[Mod[# ^ 2 + 1, 5]&, Range[0, 2], 2, AnnotationRules -> {1 -> {VertexLabels -> "one"}}]TaggedNestGraph[Mod[# ^ 2 + 1, 5]&, Range[0, 2], 2, AnnotationRules -> {DirectedEdge[_, _, 1] -> {EdgeLabels -> "one"}}]DirectedEdges (1)
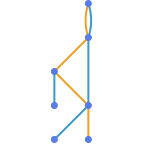
By default, a directed graph is generated:
TaggedNestGraph[Mod[# ^ 2 + 1, 5]&, Range[0, 4], 2]Use DirectedEdges->False to generate an undirected graph:
TaggedNestGraph[Mod[# ^ 2 + 1, 5]&, Range[0, 4], 2, DirectedEdges -> False]EdgeLabels (7)
TaggedNestGraph[Mod[# ^ 2 + 1, 5]&, Range[0, 2], 2, EdgeLabels -> {DirectedEdge[_, _, 1] -> "one"}]el = EdgeList[TaggedNestGraph[Mod[# ^ 2 + 1, 5]&, Range[0, 2], 2]]TaggedNestGraph[Mod[# ^ 2 + 1, 5]&, Range[0, 2], 2, EdgeLabels -> Table[el[[i]] -> Subscript["e", i], {i, Length[el]}]]Use any expression as a label:
TaggedNestGraph[Mod[# ^ 2 + 1, 5]&, Range[0, 2], 2, EdgeLabels -> {DirectedEdge[_, _, 1] -> [image], DirectedEdge[_, _, 2] -> [image]}]Use Placed with symbolic locations to control label placement along an edge:
Table[TaggedNestGraph[Mod[# ^ 2 + 1, 5]&, Range[0, 2], 2, EdgeLabels -> {DirectedEdge[1, 2, 1] -> Placed["■■■", p]}, PlotLabel -> p], {p, {"Start", "Middle", "End"}}]Use explicit coordinates to place labels:
Table[TaggedNestGraph[Mod[# ^ 2 + 1, 5]&, Range[0, 2], 2, EdgeLabels -> {DirectedEdge[1, 2, 1] -> Placed["■■■", p]}, PlotLabel -> p, BaselinePosition -> Bottom], {p, {0, 1 / 3, 1 / 2}}]Vary positions within the label:
Table[TaggedNestGraph[Mod[# ^ 2 + 1, 5]&, Range[0, 2], 2, EdgeLabels -> {DirectedEdge[1, 2, 1] -> Placed["■■■", {1 / 2, p}]}, PlotLabel -> p, BaselinePosition -> Bottom], {p, {{0, 0}, {1 / 2, 1 / 2}, {1, 1}}}]TaggedNestGraph[Mod[# ^ 2 + 1, 5]&, Range[0, 2], 2, EdgeLabels -> {DirectedEdge[1, 2, 1] -> Placed[{"lbl1", "lbl2"}, {"Start", "End"}]}]TaggedNestGraph[Mod[# ^ 2 + 1, 5]&, Range[0, 2], 2, EdgeLabels -> {DirectedEdge[1, 2, 1] -> Placed[{"lbl1", "lbl2", "lbl3"}, {"Start", "Middle", "End"}]}]Use automatic labeling by values through Tooltip and StatusArea:
TaggedNestGraph[Mod[# ^ 2 + 1, 5]&, Range[0, 2], 2, EdgeLabels -> Placed["Name", Tooltip]]TaggedNestGraph[Mod[# ^ 2 + 1, 5]&, Range[0, 2], 2, EdgeLabels -> Placed["Name", StatusArea]]EdgeShapeFunction (6)
Get a list of built-in settings for EdgeShapeFunction:
ResourceData["EdgeShapeFunction"]Undirected edges including the basic line:
TaggedNestGraph[Mod[# ^ 2 + 1, 5]&, Range[0, 2], 2, EdgeShapeFunction -> "Line"]Lines with different glyphs on the edges:
Table[TaggedNestGraph[Mod[# ^ 2 + 1, 5]&, Range[0, 2], 2, EdgeShapeFunction -> {{ef, "ArrowSize" -> 0.1}}, PlotLabel -> ef], {ef, {"BoxLine", "DiamondLine", "DotLine"}}]Directed edges including solid arrows:
Table[TaggedNestGraph[Mod[# ^ 2 + 1, 5]&, Range[0, 2], 2, EdgeShapeFunction -> {{ef, "ArrowSize" -> 0.1}}, PlotLabel -> ef], {ef, ResourceData["EdgeShapeFunction", "FilledArrow"]}]Table[TaggedNestGraph[Mod[# ^ 2 + 1, 5]&, Range[0, 2], 2, EdgeShapeFunction -> {{ef, "ArrowSize" -> 0.1}}, PlotLabel -> ef], {ef, ResourceData["EdgeShapeFunction", "UnfilledArrow"]}]Table[TaggedNestGraph[Mod[# ^ 2 + 1, 5]&, Range[0, 2], 2, EdgeShapeFunction -> {{ef, "ArrowSize" -> 0.1}}, PlotLabel -> ef], {ef, ResourceData["EdgeShapeFunction", "CarvedArrow"]}]Specify an edge function for all edges tagged 1:
TaggedNestGraph[Mod[# ^ 2 + 1, 5]&, Range[0, 2], 2, EdgeShapeFunction -> {DirectedEdge[_, _, 1] -> "DotLine"}]Combine with a different default edge function:
TaggedNestGraph[Mod[# ^ 2 + 1, 5]&, Range[0, 2], 2, EdgeShapeFunction -> {DirectedEdge[_, _, 1] -> "BoxLine", "DotLine"}]Draw edges by running a program:
ef[pts_List, e_] :=
Block[{s = 0.015, g = [image]}, {Arrowheads[{{s, 0.33, g}, {s, 0.67, g}}], Arrow[pts]}]TaggedNestGraph[Mod[# ^ 2 + 1, 5]&, Range[0, 2], 2, EdgeShapeFunction -> ef]EdgeShapeFunction can be combined with EdgeStyle:
TaggedNestGraph[Mod[# ^ 2 + 1, 5]&, Range[0, 2], 2, EdgeStyle -> Blue, EdgeShapeFunction -> (Line[#1]&)]EdgeShapeFunction has higher priority than EdgeStyle:
TaggedNestGraph[Mod[# ^ 2 + 1, 5]&, Range[0, 2], 2, EdgeStyle -> Blue, EdgeShapeFunction -> ({Red, Line[#1]}&)]EdgeStyle (2)
Table[TaggedNestGraph[Mod[# ^ 2 + 1, 5]&, Range[0, 2], 2, EdgeStyle -> style, PlotLabel -> style], {style, {Gray, Dashed, Thick}}]Style edges based on their tag:
TaggedNestGraph[{2 #, 2 # + 1}&, 1, 2, EdgeStyle -> {DirectedEdge[_, _, 1] -> Blue, DirectedEdge[_, _, 2] -> Dashed}]EdgeWeight (2)
Specify a weight for all edges:
TaggedNestGraph[Mod[# ^ 2 + 1, 5]&, Range[0, 2], 2, EdgeWeight -> RandomInteger[5, 3]]WeightedAdjacencyMatrix[%]//MatrixFormUse any numeric expression as a weight:
TaggedNestGraph[Mod[# ^ 2 + 1, 5]&, Range[0, 2], 2, EdgeWeight -> {a, b, c}]WeightedAdjacencyMatrix[%]//MatrixFormGraphHighlight (3)
TaggedNestGraph[Mod[# ^ 2 + 1, 5]&, Range[0, 2], 2, VertexSize -> Tiny, GraphHighlight -> {1}]TaggedNestGraph[Mod[# ^ 2 + 1, 5]&, Range[0, 2], 2, VertexSize -> Tiny, GraphHighlight -> {DirectedEdge[_, _, 1]}]TaggedNestGraph[Mod[# ^ 2 + 1, 5]&, Range[0, 2], 2, VertexSize -> Tiny, GraphHighlight -> {1, 2, 3, DirectedEdge[1, 2, _], DirectedEdge[1, 3, _]}]GraphHighlightStyle (2)
Get a list of built-in settings for GraphHighlightStyle:
ResourceData["GraphHighlightStyle"]Use built-in settings for GraphHighlightStyle:
TaggedNestGraph[Mod[# ^ 2 + 1, 5]&, Range[0, 2], 2, GraphHighlight -> {1, DirectedEdge[1, 2, 1]}, VertexSize -> Small, GraphHighlightStyle -> #, PlotLabel -> #]& /@ Select[ResourceData["GraphHighlightStyle"], # =!= Automatic&]GraphLayout (5)
By default, the layout is chosen automatically:
TaggedNestGraph[Mod[# ^ 2 + 1, 5]&, Range[0, 10], 2, GraphLayout -> Automatic]Specify layouts on special curves:
Table[TaggedNestGraph[Mod[# ^ 2 + 1, 5]&, Range[0, 10], 2, GraphLayout -> l, PlotLabel -> l], {l, {"CircularEmbedding", "SpiralEmbedding"}}]Specify layouts that satisfy optimality criteria:
Table[TaggedNestGraph[Mod[# ^ 2 + 1, 5]&, Range[0, 20], 2, GraphLayout -> l, PlotLabel -> l], {l, {"SpringEmbedding", "SpringElectricalEmbedding", "HighDimensionalEmbedding"}}]VertexCoordinates overrides GraphLayout coordinates:
{TaggedNestGraph[Mod[# ^ 2 + 1, 5]&, Range[0, 5], 2, GraphLayout -> "SpringElectricalEmbedding"],
	TaggedNestGraph[Mod[# ^ 2 + 1, 5]&, Range[0, 5], 2, GraphLayout -> "SpringElectricalEmbedding", VertexCoordinates -> Table[{i, i}, {i, 0, 5}]]}
Use AbsoluteOptions to extract VertexCoordinates computed using a layout algorithm:
TaggedNestGraph[Mod[# ^ 2 + 1, 5]&, Range[0, 5], 2]AbsoluteOptions[%, VertexCoordinates]PlotTheme (4)
Base Themes (2)
TaggedEdgeStyle (3)
Style edges based on their tag:
TaggedNestGraph[{2 #, 2 # + 1}&, 1, 2, TaggedEdgeStyle -> {1 -> Red, 2 -> Blue}]TaggedNestGraph[{2 #, 2 # + 1}&, 1, 2, TaggedEdgeStyle -> Dashed]Directives given to individual tags take precedence over those given to all tags:
TaggedNestGraph[{2 #, 2 # + 1}&, 1, 2, TaggedEdgeStyle -> {1 -> Red, Blue}]VertexCoordinates (3)
By default, any vertex coordinates are computed automatically:
TaggedNestGraph[Mod[# ^ 2 + 1, 5]&, Range[0, 2], 2]Extract the resulting vertex coordinates using AbsoluteOptions:
AbsoluteOptions[%, VertexCoordinates]Specify a layout function along an ellipse:
ellipseLayout[n_, {a_, b_}] := Table[{a Cos[2Pi / n u], b Sin[2Pi / n u]}, {u, 1, n}]Graphics[Point[ellipseLayout[21, {2, 1}]]]Use it to generate vertex coordinates for a graph:
TaggedNestGraph[Mod[# ^ 2 + 1, 5]&, Range[0, 20], 2, VertexCoordinates -> ellipseLayout[21, {2, 1}]]VertexCoordinates has higher priority than GraphLayout:
TaggedNestGraph[Mod[# ^ 2 + 1, 5]&, Range[0, 2], 2, VertexCoordinates -> Table[{i, i}, {i, 0, 2}], GraphLayout -> "CircularEmbedding"]VertexLabels (13)
TaggedNestGraph[Mod[# ^ 2 + 1, 5]&, Range[0, 2], 2, VertexLabels -> "Name"]TaggedNestGraph[Mod[# ^ 2 + 1, 5]&, Range[0, 2], 2, VertexLabels -> {2 -> "two"}]TaggedNestGraph[Mod[# ^ 2 + 1, 5]&, Range[0, 2], 2, VertexLabels -> Table[i -> Subscript[v, i], {i, 0, 2}]]Use any expression as a label:
TaggedNestGraph[Mod[# ^ 2 + 1, 5]&, Range[0, 2], 2, VertexLabels -> {0 -> [image], 1 -> [image], 2 -> [image]}]Use Placed with symbolic locations to control label placement, including outside positions:
Table[TaggedNestGraph[Mod[# ^ 2 + 1, 5]&, Range[0, 2], 2, VertexShapeFunction -> "Square", VertexLabels -> Table[i -> Placed["■■■", p], {i, 0, 2}], PlotLabel -> p], {p, {Before, After, Below, Above}}]Symbolic outside-corner positions:
pl = {{Before, Below}, {After, Below}, {Before, Above}, {After, Above}};Table[TaggedNestGraph[Mod[# ^ 2 + 1, 5]&, Range[0, 2], 2, VertexShapeFunction -> "Square", VertexLabels -> Table[i -> Placed["■■■", p], {i, 0, 2}], PlotLabel -> p], {p, pl}]Table[TaggedNestGraph[Mod[# ^ 2 + 1, 5]&, Range[0, 2], 2, VertexSize -> 0.45, VertexLabels -> Table[i -> Placed["■■■", p], {i, 0, 2}], VertexShapeFunction -> "Square", PlotLabel -> p], {p, {Left, Top, Right, Bottom}}]Symbolic inside-corner positions:
pl = {{Left, Bottom}, {Right, Bottom}, {Left, Top}, {Right, Top}};Table[TaggedNestGraph[Mod[# ^ 2 + 1, 5]&, Range[0, 2], 2, VertexSize -> 0.45, VertexShapeFunction -> "Square", VertexLabels -> Table[i -> Placed["■■■", p], {i, 0, 2}], PlotLabel -> p], {p, pl}]Use explicit coordinates to place the centers of labels:
Table[TaggedNestGraph[Mod[# ^ 2 + 1, 5]&, Range[0, 2], 2, VertexSize -> 0.25, VertexShapeFunction -> "Square", VertexLabels -> Table[i -> Placed[[image], p], {i, 0, 2}], PlotLabel -> p, BaselinePosition -> Bottom], {p, {{0, 0}, {1 / 2, 1 / 2}, {1, 1}}}]Place all labels at the upper-right corner of the vertex and vary the coordinates within the label:
Table[TaggedNestGraph[Mod[# ^ 2 + 1, 5]&, Range[0, 2], 2, VertexSize -> 0.35, VertexShapeFunction -> "Square", VertexLabels -> Table[i -> Placed[[image], {{1, 1}, p}], {i, 0, 2}], PlotLabel -> p, BaselinePosition -> Bottom], {p, {{0, 0}, {1 / 2, 1 / 2}, {1, 1}}}]TaggedNestGraph[Mod[# ^ 2 + 1, 5]&, Range[0, 2], 2, VertexLabels -> {1 -> Placed[{"lbl1", "lbl2"}, {Above, Below}]}]Any number of labels can be used:
TaggedNestGraph[Mod[# ^ 2 + 1, 5]&, Range[0, 2], 2, VertexLabels -> {1 -> Placed[{"lbl1", "lbl2", "lbl3", "lbl4"}, {Above, After, Below, Before}]}]Use the argument Placed to control formatting including Tooltip:
TaggedNestGraph[Mod[# ^ 2 + 1, 5]&, Range[0, 2], 2, VertexLabels -> Placed["Name", Tooltip]]Or StatusArea:
TaggedNestGraph[Mod[# ^ 2 + 1, 5]&, Range[0, 2], 2, VertexLabels -> Placed["Name", StatusArea]]Use more elaborate formatting functions:
rotateLabel[lbl_] := Rotate[lbl, 45Degree]TaggedNestGraph[Mod[# ^ 2 + 1, 5]&, Range[0, 2], 2, VertexLabels -> Table[i -> Placed["xxx", Below, rotateLabel], {i, 0, 2}]]panelLabel[lbl_] := Panel[lbl, FrameMargins -> 0, Background -> StandardYellow]TaggedNestGraph[Mod[# ^ 2 + 1, 5]&, Range[0, 2], 2, VertexLabels -> Table[i -> Placed["xxx", Center, panelLabel], {i, 0, 2}]]hyperlinkLabel[lbl_] := Hyperlink[lbl, "http://www.wolfram.com"]TaggedNestGraph[Mod[# ^ 2 + 1, 5]&, Range[0, 2], 2, VertexLabels -> Table[i -> Placed["xxx", Center, hyperlinkLabel], {i, 0, 2}]]VertexShape (5)
Use any Graphics, Image or Graphics3D as a vertex shape:
Table[TaggedNestGraph[Mod[# ^ 2 + 1, 5]&, Range[0, 2], 2, VertexShape -> s, VertexSize -> Medium], {s, {[image], [image], [image]}}]Specify vertex shapes for individual vertices:
TaggedNestGraph[Mod[# ^ 2 + 1, 5]&, Range[0, 2], 2, VertexShape -> {2 -> [image]}, VertexSize -> Medium]VertexShape can be combined with VertexSize:
Table[TaggedNestGraph[Mod[# ^ 2 + 1, 5]&, Range[0, 2], 2, VertexSize -> s, VertexShape -> [image], PlotLabel -> s], {s, {Small, Large}}]VertexShape is not affected by VertexStyle:
TaggedNestGraph[Mod[# ^ 2 + 1, 5]&, Range[0, 2], 2, VertexSize -> 0.2, VertexShape -> [image], VertexStyle -> Blue]VertexShapeFunction has higher priority than VertexShape:
TaggedNestGraph[Mod[# ^ 2 + 1, 5]&, Range[0, 2], 2, VertexSize -> 0.2, VertexShapeFunction -> "Square", VertexShape -> [image]]VertexShapeFunction (10)
Get a list of built-in collections for VertexShapeFunction:
ResourceData["VertexShapeFunction"]Use built-in settings for VertexShapeFunction in the "Basic" collection:
ResourceData["VertexShapeFunction", "Basic"]Table[TaggedNestGraph[Mod[# ^ 2 + 1, 5]&, Range[0, 2], 2, VertexShapeFunction -> vf, VertexSize -> 0.3, PlotLabel -> vf], {vf, {"Triangle", "Square", "Rectangle", "Pentagon", "Hexagon", "Octagon"}}]Table[TaggedNestGraph[Mod[# ^ 2 + 1, 5]&, Range[0, 2], 2, VertexShapeFunction -> vf, VertexSize -> 0.3, PlotLabel -> vf], {vf, {"DownTrapezoid", "UpTrapezoid", "Parallelogram", "FiveDown", "Circle", "Diamond", "Star", "Capsule"}}]Use built-in settings for VertexShapeFunction in the "Rounded" collection:
ResourceData["VertexShapeFunction", "Rounded"]Table[TaggedNestGraph[Mod[# ^ 2 + 1, 5]&, Range[0, 2], 2, VertexShapeFunction -> vf, VertexSize -> 0.3, PlotLabel -> vf], {vf, ResourceData["VertexShapeFunction", "Rounded"]}]Use built-in settings for VertexShapeFunction in the "Concave" collection:
ResourceData["VertexShapeFunction", "Concave"]Table[TaggedNestGraph[Mod[# ^ 2 + 1, 5]&, Range[0, 2], 2, VertexShapeFunction -> vf, VertexSize -> 0.3, PlotLabel -> vf], {vf, ResourceData["VertexShapeFunction", "Concave"]}]TaggedNestGraph[Mod[# ^ 2 + 1, 5]&, Range[0, 2], 2, VertexShapeFunction -> { 1 -> "Square"}, VertexSize -> 0.3]Combine with a default vertex function:
TaggedNestGraph[Mod[# ^ 2 + 1, 5]&, Range[0, 2], 2, VertexShapeFunction -> { 1 -> "Square", "Triangle"}, VertexSize -> 0.3]Draw vertices using a predefined graphic:
TaggedNestGraph[Mod[# ^ 2 + 1, 5]&, Range[0, 2], 2, VertexShapeFunction -> (Inset[[image], #]&)]Draw vertices by running a program:
vf[{xc_, yc_}, name_, {w_, h_}] :=
	Block[{xmin = xc - w, xmax = xc + w, ymin = yc - h, ymax = yc + h},
	Polygon[{{xmin, ymin}, {xmax, ymax}, {xmin, ymax}, {xmax, ymin}}]
];TaggedNestGraph[Mod[# ^ 2 + 1, 5]&, Range[0, 2], 2, VertexShapeFunction -> vf, VertexSize -> 0.3]VertexShapeFunction can be combined with VertexStyle:
vf1[{xc_, yc_}, name_, {w_, h_}] := Rectangle[{xc - w, yc - h}, {xc + w, yc + h}]TaggedNestGraph[Mod[# ^ 2 + 1, 5]&, Range[0, 2], 2, VertexSize -> 0.3, VertexStyle -> Blue, VertexShapeFunction -> vf1]VertexShapeFunction has higher priority than VertexStyle:
vf2[{xc_, yc_}, name_, {w_, h_}] := {Red, Rectangle[{xc - w, yc - h}, {xc + w, yc + h}]}TaggedNestGraph[Mod[# ^ 2 + 1, 5]&, Range[0, 2], 2, VertexSize -> 0.3, VertexStyle -> Blue, VertexShapeFunction -> vf2]VertexShapeFunction has higher priority than VertexSize:
TaggedNestGraph[Mod[# ^ 2 + 1, 5]&, Range[0, 2], 2, VertexShapeFunction -> "Star", VertexSize -> {1 -> Small, Medium}]VertexShapeFunction has higher priority than VertexShape:
TaggedNestGraph[Mod[# ^ 2 + 1, 5]&, Range[0, 2], 2, VertexSize -> 0.3, VertexShapeFunction -> "Star", VertexShape -> [image]]VertexSize (8)
By default, the size of vertices is computed automatically:
TaggedNestGraph[Mod[# ^ 2 + 1, 5]&, Range[0, 2], 2, VertexSize -> Automatic]Specify the size of all vertices using symbolic vertex size:
Table[TaggedNestGraph[Mod[# ^ 2 + 1, 5]&, Range[0, 2], 2, VertexSize -> s, PlotLabel -> s], {s, {Tiny, Small, Medium, Large}}]Use a fraction of the minimum distance between vertex coordinates:
Table[TaggedNestGraph[Mod[# ^ 2 + 1, 5]&, Range[0, 2], 2, VertexSize -> s, PlotLabel -> s], {s, 0.1, 1, 0.3}]Use a fraction of the overall diagonal for all vertex coordinates:
Table[TaggedNestGraph[Mod[# ^ 2 + 1, 5]&, Range[0, 2], 2, VertexSize -> {"Scaled", s}, PlotLabel -> {"Scaled", s}], {s, 0.1, 1, 0.3}]Specify size in both the ![]() and
and ![]() directions:
directions:
Table[TaggedNestGraph[Mod[# ^ 2 + 1, 5]&, Range[0, 2], 2, VertexSize -> s, PlotLabel -> s], {s, {{0.1, 0.2}, {0.2, 0.1}}}]Specify the size for individual vertices:
TaggedNestGraph[Mod[# ^ 2 + 1, 5]&, Range[0, 2], 2, VertexSize -> {1 -> 0.2, 2 -> 0.3}]VertexSize can be combined with VertexShapeFunction:
Table[TaggedNestGraph[Mod[# ^ 2 + 1, 5]&, Range[0, 2], 2, VertexSize -> s, VertexShapeFunction -> "Square", PlotLabel -> s], {s, {0.05, 0.1, 0.2}}]VertexSize can be combined with VertexShape:
Table[TaggedNestGraph[Mod[# ^ 2 + 1, 5]&, Range[0, 2], 2, VertexSize -> s, VertexShape -> [image], PlotLabel -> s], {s, {0.1, 0.2, 0.4}}]VertexStyle (5)
Table[TaggedNestGraph[Mod[# ^ 2 + 1, 5]&, Range[0, 2], 2, VertexStyle -> style, VertexSize -> 0.3, PlotLabel -> style], {style, {Yellow, EdgeForm[Dashed]}}]TaggedNestGraph[Mod[# ^ 2 + 1, 5]&, Range[0, 2], 2, VertexStyle -> {1 -> Blue, 2 -> Red}, VertexSize -> 0.2]VertexShapeFunction can be combined with VertexStyle:
vf1[{xc_, yc_}, name_, {w_, h_}] := Rectangle[{xc - w, yc - h}, {xc + w, yc + h}]TaggedNestGraph[Mod[# ^ 2 + 1, 5]&, Range[0, 2], 2, VertexSize -> 0.3, VertexStyle -> Blue, VertexShapeFunction -> vf1]VertexShapeFunction has higher priority than VertexStyle:
vf2[{xc_, yc_}, name_, {w_, h_}] := {Red, Rectangle[{xc - w, yc - h}, {xc + w, yc + h}]}TaggedNestGraph[Mod[# ^ 2 + 1, 5]&, Range[0, 2], 2, VertexSize -> 0.3, VertexStyle -> Blue, VertexShapeFunction -> vf2]VertexStyle can be combined with BaseStyle:
TaggedNestGraph[Mod[# ^ 2 + 1, 5]&, Range[0, 2], 2, VertexStyle -> LightBlue, BaseStyle -> EdgeForm[Dotted], VertexSize -> 0.3]VertexStyle has higher priority than BaseStyle:
TaggedNestGraph[Mod[# ^ 2 + 1, 5]&, Range[0, 2], 2, VertexStyle -> LightBlue, BaseStyle -> Gray, VertexSize -> 0.3]VertexShape is not affected by VertexStyle:
TaggedNestGraph[Mod[# ^ 2 + 1, 5]&, Range[0, 2], 2, VertexSize -> 0.3, VertexShape -> [image], VertexStyle -> Blue]VertexWeight (2)
Set the weight for all vertices:
TaggedNestGraph[Mod[# ^ 2 + 1, 5]&, Range[0, 2], 2, VertexWeight -> -Range[0, 2]]AnnotationValue[{%, 2}, VertexWeight]Use any numeric expression as a weight:
TaggedNestGraph[Mod[# ^ 2 + 1, 5]&, Range[0, 2], 2, VertexWeight -> {a, b, c}]AnnotationValue[{%, 2}, VertexWeight]Applications (6)
Neighborhood Graphs (2)
Generate a network of "nearby" functions in the Wolfram Language:
TaggedNestGraph[WolframLanguageData[#, EntityProperty["WolframLanguageSymbol", "RelatedSymbols"]]&, Entity["WolframLanguageSymbol", "Nest"], 2, VertexLabels -> "Name"]Generate a graph of neighboring countries around Switzerland:
TaggedNestGraph[#["BorderingCountries"]&, ["switzerland"], 2, VertexLabels -> Automatic]Web Crawler (1)
Generate a web crawl graph featuring the first six hyperlinks on each page:
crawlGraph = TaggedNestGraph[Take[Import[#, "Hyperlinks"], 6]&, "http://www.wolfram.com", 3, VertexLabels -> Placed["Name", Tooltip], EdgeStyle -> {DirectedEdge[_, _, i_] :> ColorData[2][i]}]Count the paths from the first site to the last:
Length@FindPath[crawlGraph, First@VertexList@crawlGraph, Last@VertexList@crawlGraph, Infinity, All]View the graph as a 3D layered plot:
LayeredGraphPlot3D[crawlGraph]File System (2)
Build a graph of a computer directory structure:
g = TaggedNestGraph[FileNames["*", #] &, $InstallationDirectory, 3]Compute the number of subdirectories:
VertexCount[g] - 1g = TaggedNestGraph[FileNames["*", #] &, $InstallationDirectory, 3, EdgeStyle -> Arrowheads[0]];LayeredGraphPlot[g]GraphPlot[g, GraphLayout -> "BalloonEmbedding"]Expression Decomposition (1)
expr = f[3 * x + 4 * y, (2 + x) * z ^ k, (z - 1) * (x + y)];
dec = TaggedNestGraph[Apply[List], expr, Depth[expr] - 1, VertexLabels -> Automatic]
Change the vertex label of each compound expression to its head:
Graph[dec, VertexLabels -> ((# -> If[VertexOutDegree[dec, #] == 0, #, Head@#])& /@ VertexList[dec])]Properties & Relations (5)
TaggedNestGraph is NestGraph with tags applied to the edges:
tng = TaggedNestGraph[{2 #, 2 # + 1}&, 1, 3, VertexLabels -> Automatic, EdgeLabels -> "EdgeTag"]ng = NestGraph[{2 #, 2 # + 1}&, 1, 3, VertexLabels -> Automatic, EdgeLabels -> "EdgeTag"]EdgeTaggedGraphQ discriminates between the two outputs:
EdgeTaggedGraphQ /@ {tng, ng}Generate a tree of nested functions as lists:
NestList[{f[#], g[#]}&, x, 3]TaggedNestGraph[{f[#], g[#]}&, x, 3, VertexLabels -> "Name"]Use VertexList, EdgeList and EdgeTags to enumerate vertices, edges and edge tags in standard order:
g = TaggedNestGraph[WordData[#, "Synonyms", "List"] &, "tree", 2]{VertexList[g], EdgeList[g], EdgeTags[g]}Use VertexCount and EdgeCount to count vertices and edges:
g = TaggedNestGraph[Mod[# ^ 2 + 1, 10]&, {1, 2, 3, 4, 5}, 2]{VertexCount[g], EdgeCount[g]}Use UndirectedGraph to turn the directed graph into an undirected one:
dg = TaggedNestGraph[f, x, 3]ug = UndirectedGraph[dg]Compute the AdjacencyMatrix of both:
MatrixForm /@ AdjacencyMatrix /@ {dg, ug}Neat Examples (1)
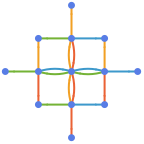
Create a graph whose paths from the origin represent random grid walks:
step[Point[{x_, y_}]] := Point /@ {{x + 1, y}, {x, y + 1}, {x - 1, y}, {x, y - 1}};
g = TaggedNestGraph[
	step,
	Point[{0, 0}],
	4,
	VertexLabels -> {Point[p_] :> ToString[p]},
	VertexCoordinates -> {Point[p_] :> p},
	EdgeLabels -> {DirectedEdge[_, _, t_] :> Switch[t, 1, "E", 2, "N", 3, "W", 4, "S"]}
]HighlightGraph[g, Style[Join@@FoldList[{DirectedEdge[Last@#1, step[Last@#1][[#2]], #2], step[Last@#1][[#2]]}&, {Point[{0, 0}]}, RandomChoice[Range[4], 4]], Red, Thickness[.01]]]Text
Wolfram Research (2026), TaggedNestGraph, Wolfram Language function, https://reference.wolfram.com/language/ref/TaggedNestGraph.html.
CMS
Wolfram Language. 2026. "TaggedNestGraph." Wolfram Language & System Documentation Center. Wolfram Research. https://reference.wolfram.com/language/ref/TaggedNestGraph.html.
APA
Wolfram Language. (2026). TaggedNestGraph. Wolfram Language & System Documentation Center. Retrieved from https://reference.wolfram.com/language/ref/TaggedNestGraph.html