


MoleculePlot3D
MoleculePlot3D[mol]
creates a three-dimensional model of the molecule mol.
MoleculePlot3D[mol,patt]
creates a model of mol where all atoms and bonds matching the pattern patt are highlighted.
Details and Options
- If the molecule does not have structure diagram coordinates, they will be generated automatically according to the molecule's AtomCoordinates option.
- mol can be a Molecule object or something that can be easily converted to one, such as a systematic chemical name, a "Chemical" entity or ExternalIdentifier.
- Possible forms for patt include:
-
n the index of a particular atom Atom[…] a pattern for an atom Bond[…] a pattern for a bond MoleculePattern[…] a pattern for a molecule substructure {patt1,patt2,…} a list of patterns <label1patt1,…> an Association of labels and patterns - Patterns entered as Style[patt,spec]will be styled according to spec.
- MoleculePlot3D has the same options as Graphics3D, with the following additions and changes: [List of all options]
-
AtomLabels None labels and label placements for atoms AtomLabelStyle Automatic style to use for atom labels BondLabels None labels and label placements for bonds BondLabelStyle Automatic style to use for bond labels Boxed False whether to draw the bounding box ColorRules Automatic a list of rules IncludeHydrogens True whether to show hydrogen atoms PlotLegends None legends for highlights PlotTheme Automatic overall theme for the plot - Supported plot themes include:
-
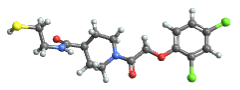
"BallAndStick" display atoms and bonds using Sphere and Cylinder primitives 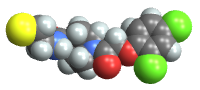
"Spacefilling" atoms are depicted with spheres with radius matching the van der Waals radius 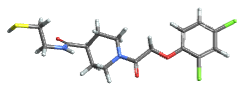
"Tubes" atoms omitted 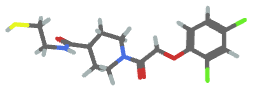
"Wireframe" bonds rendered as lines - Typical settings for PlotLegends include:
-
None no legend Automatic automatically determine legend {lbl1,lbl2,…} use lbl1, lbl2, … as legend labels Placed[lspec,…] specify placement for legend - When patt is entered as an Association, the labeli will be used in the PlotLegends.
List of all options
Examples
open all close allBasic Examples (3)
Create a molecule and plot it in 3D:
MoleculePlot3D[Molecule["NC(=O)C[C@H](C(=O)O)N"]]Highlight the first and third atoms:
MoleculePlot3D[Molecule["NC(=O)C[C@H](C(=O)O)N"], {1, 3}]MoleculePlot3D[Molecule["NC(=O)C[C@H](C(=O)O)N"], Atom["O"]]Highlight two different patterns:
MoleculePlot3D["O=C(C1CCC1)S[C@@H]1CCC1(C)C", <|"carbonyl" -> Bond[{"C", "O"}, "Double"], "ring carbons" -> Atom["C", "RingAtomQ" -> True]|>]MoleculePlot3D[Molecule["CCCC"], PlotTheme -> #]& /@ {"Wireframe", "Tubes", "BallAndStick", "SpaceFilling"}Scope (2)
A pattern can match one or multiple positions in a molecule:
m = Molecule[{Atom["C"], Atom["C"], Atom["C"], Atom["O"], Atom["N"], Atom["C"], Atom["O"], Atom["N"],
  Atom["C"], Atom["C"], Atom["C"], Atom["O"], Atom["O"], Atom["C"], Atom["N"], Atom["C"],
  Atom["C"], Atom["O"], Atom["O"], Atom["C"], Atom["C"], A ... er" -> 10, "Direction" -> "Clockwise", "FiducialAtom" -> 9,
    "Ligands" -> {11, 5, 34}], Association["StereoType" -> "Tetrahedral", "ChiralCenter" -> 16,
    "Direction" -> "Counterclockwise", "FiducialAtom" -> 15, "Ligands" -> {17, 20, 40}]}];
carbonylPattern = Bond[{"C", "O"}, "Double"];
Highlight each carbonyl separately:
MoleculePlot3D[m, carbonylPattern]Highlight each carbonyl as a single color:
MoleculePlot3D[m, {carbonylPattern}]MoleculePlot3D[Molecule[{Atom["C"], Atom["N"], Atom["C"], Atom["C"], Atom["C"], Atom["N"], Atom["C"], Atom["O"],
Atom["C"], Atom["C"], Atom["C"], Atom["C"], Atom["H"], Atom["H"], Atom["H"], Atom["H"],
Atom["H"], Atom["H"], Atom["H"], Atom["H"], Atom["H"], A ... e"],
Bond[{6, 22}, "Single"], Bond[{10, 23}, "Single"], Bond[{10, 24}, "Single"],
Bond[{11, 25}, "Single"], Bond[{11, 26}, "Single"], Bond[{11, 27}, "Single"],
Bond[{12, 28}, "Single"], Bond[{12, 29}, "Single"], Bond[{12, 30}, "Single"]}], {1, Bond[{"C", "C"}, "Double"]}]Options (25)
AtomLabels (1)
Label all atoms by their index:
MoleculePlot3D[Molecule["2,3-dichloro-4-nitro-1H-pyrrole"], AtomLabels -> "AtomIndex"]Label only chlorine atoms by their index:
MoleculePlot3D[Molecule["2,3-dichloro-4-nitro-1H-pyrrole"], AtomLabels -> {Atom["Cl"] -> "AtomIndex"}]Label non-hydrogen atoms by their hybridization:
MoleculePlot3D[Molecule["2,3-dichloro-4-nitro-1H-pyrrole"], AtomLabels -> {Atom[Except["H"]] -> MoleculeProperty["OrbitalHybridization"]}]AtomLabelStyle (1)
Set all labels to have the same style:
MoleculePlot3D[Molecule["2,3-dichloro-4-nitro-1H-pyrrole"], AtomLabels -> "AtomIndex", AtomLabelStyle -> Directive[FontSize -> 16, Blue]]Set the label style depending on atom type:
MoleculePlot3D[Molecule["2,3-dichloro-4-nitro-1H-pyrrole"], AtomLabels -> "AtomIndex", AtomLabelStyle -> {Atom["C"] -> Directive[16, Blue], Atom["O"] -> Directive[22, Purple, Bold], _ -> Italic}]BondLabels (1)
Label all bonds by their index:
MoleculePlot3D[Molecule["2,3-dichloro-4-nitro-1H-pyrrole"], BondLabels -> "BondIndex"]Label only bonds to chlorine atoms by their bond type:
MoleculePlot3D[Molecule["2,3-dichloro-4-nitro-1H-pyrrole"], BondLabels -> {Bond[{"Cl", _}] -> MoleculeProperty["BondType"]}]BondLabelStyle (1)
Give all bond labels the same style:
MoleculePlot3D[Molecule["2,3-dichloro-4-nitro-1H-pyrrole"], BondLabels -> "BondIndex", BondLabelStyle -> Directive[FontSize -> 22, Red]]Label bonds differently based on their atoms:
MoleculePlot3D[Molecule["2,3-dichloro-4-nitro-1H-pyrrole"], BondLabels -> "BondIndex", BondLabelStyle -> {Bond[{"N", _}] -> Directive[FontSize -> 22, Red], Bond[{"Cl", _}] -> Directive[FontSize -> 22, Blue]}]Axes (4)
By default, Axes are not drawn:
MoleculePlot3D[Molecule["Nc1nccc(n1)c1c(C)onc1c1ccccc1"]]Use AxesTrue to turn on axes:
MoleculePlot3D[Molecule["Nc1nccc(n1)c1c(C)onc1c1ccccc1"], Axes -> True]Use AxesOrigin to specify where the axes intersect:
MoleculePlot3D[Molecule["Nc1nccc(n1)c1c(C)onc1c1ccccc1"], Axes -> True, AxesOrigin -> {0, 0, 0}]Turn on each axis individually:
{MoleculePlot3D[Molecule["Nc1nccc(n1)c1c(C)onc1c1ccccc1"], Axes -> {True, False, False}], MoleculePlot3D[Molecule["Nc1nccc(n1)c1c(C)onc1c1ccccc1"], Axes -> {False, True, False}], MoleculePlot3D[Molecule["Nc1nccc(n1)c1c(C)onc1c1ccccc1"], Axes -> {False, False, True}]}AxesLabel (3)
No axes labels are drawn by default:
MoleculePlot3D[Molecule["Nc1nccc(n1)c1c(C)onc1c1ccccc1"], Axes -> True]MoleculePlot3D[Molecule["Nc1nccc(n1)c1c(C)onc1c1ccccc1"], Axes -> True, AxesLabel -> z]MoleculePlot3D[Molecule["Nc1nccc(n1)c1c(C)onc1c1ccccc1"], Axes -> True, AxesLabel -> {x, y, z}]AxesOrigin (2)
The position of the axes is determined automatically:
MoleculePlot3D[Molecule["Nc1nccc(n1)c1c(C)onc1c1ccccc1"], Axes -> True]Specify an explicit origin for the axes:
MoleculePlot3D[Molecule["Nc1nccc(n1)c1c(C)onc1c1ccccc1"], Axes -> True, AxesOrigin -> {0, 0, 0}]AxesStyle (4)
Change the style for the axes:
MoleculePlot3D[Molecule["Nc1nccc(n1)c1c(C)onc1c1ccccc1"], Axes -> True, AxesStyle -> Red]Specify the style of each axis:
MoleculePlot3D[Molecule["Nc1nccc(n1)c1c(C)onc1c1ccccc1"], Axes -> True, AxesStyle -> {{Thick, Brown}, {Thick, Blue}, {Thick, Green}}]Use different styles for the ticks and the axes:
MoleculePlot3D[Molecule["Nc1nccc(n1)c1c(C)onc1c1ccccc1"], Axes -> True, AxesStyle -> Green, TicksStyle -> Black]Use different styles for the labels and the axes:
MoleculePlot3D[Molecule["Nc1nccc(n1)c1c(C)onc1c1ccccc1"], Axes -> True, AxesStyle -> Green, LabelStyle -> Red]ColorRules (1)
Specify different colors for atomic elements:
m = Molecule["Nc1nccc(n1)c1c(C)onc1c1ccccc1"]MoleculePlot3D[m]MoleculePlot3D[m, ColorRules -> {"C" -> RGBColor[0.79, 0.34, 0.5], "N" -> RGBColor[0.5, 0.51, 0.81], _ -> GrayLevel[.7]}]ImageSize (4)
Use named sizes, such as Tiny, Small, Medium and Large:
{MoleculePlot3D[Molecule["Nc1nccc(n1)c1c(C)onc1c1ccccc1"], ImageSize -> Tiny], MoleculePlot3D[Molecule["Nc1nccc(n1)c1c(C)onc1c1ccccc1"], ImageSize -> Small]}Specify the width of the plot:
{MoleculePlot3D[Molecule["Nc1nccc(n1)c1c(C)onc1c1ccccc1"], ImageSize -> 150], MoleculePlot3D[Molecule["Nc1nccc(n1)c1c(C)onc1c1ccccc1"], AspectRatio -> 1.5, ImageSize -> 150]}Specify the height of the plot:
{MoleculePlot3D[Molecule["Nc1nccc(n1)c1c(C)onc1c1ccccc1"], ImageSize -> {Automatic, 150}], MoleculePlot3D[Molecule["Nc1nccc(n1)c1c(C)onc1c1ccccc1"], AspectRatio -> 2, ImageSize -> {Automatic, 150}]}Allow the width and height to be up to a certain size:
{MoleculePlot3D[Molecule["Nc1nccc(n1)c1c(C)onc1c1ccccc1"], ImageSize -> UpTo[200]], MoleculePlot3D[Molecule["Nc1nccc(n1)c1c(C)onc1c1ccccc1"], AspectRatio -> 2, ImageSize -> UpTo[200]]}Use maximum sizes for the width and height:
{MoleculePlot3D[Molecule["Nc1nccc(n1)c1c(C)onc1c1ccccc1"], ImageSize -> {UpTo[150], UpTo[100]}], MoleculePlot3D[Molecule["Nc1nccc(n1)c1c(C)onc1c1ccccc1"], AspectRatio -> 2, ImageSize -> {UpTo[150], UpTo[100]}]}IncludeHydrogens (1)
By default, all hydrogen atoms are shown:
MoleculePlot3D[Molecule["2-cycloheptanol"]]MoleculePlot3D[Molecule["2-cycloheptanol"], IncludeHydrogens -> None]Create a molecule with only a few explicit hydrogens and show them in 3D:
MoleculePlot3D[Molecule["[H]C([H])=CC"], IncludeHydrogens -> "ExplicitOnly"]PlotLegends (1)
Use placeholders for plot legends:
m = Molecule[{Atom["C"], Atom["N"], Atom["C"], Atom["C"], Atom["C"], Atom["N"], Atom["C"], Atom["O"],
  Atom["C"], Atom["C"], Atom["C"], Atom["C"], Atom["H"], Atom["H"], Atom["H"], Atom["H"],
  Atom["H"], Atom["H"], Atom["H"], Atom["H"], Atom["H"], A ... e"],
  Bond[{6, 22}, "Single"], Bond[{10, 23}, "Single"], Bond[{10, 24}, "Single"],
  Bond[{11, 25}, "Single"], Bond[{11, 26}, "Single"], Bond[{11, 27}, "Single"],
Bond[{12, 28}, "Single"], Bond[{12, 29}, "Single"], Bond[{12, 30}, "Single"]}];MoleculePlot3D[m, {1, Bond[{"C", "C"}, "Double"]}, PlotLegends -> Automatic]Use the expressions to label the highlights:
MoleculePlot3D[m, {1, Bond[{"C", "C"}, "Double"]}, PlotLegends -> Placed["Expressions", Below]]Neat Examples (1)
Combine a 3D molecule plot with a surface mesh using MoleculeMesh:
With[{m = Molecule[{"O", "C", Atom["C", "HydrogenCount" -> 1], "C", "C", "C",
  Atom["C", "HydrogenCount" -> 1], Atom["C", "HydrogenCount" -> 1], "O", "C", "C",
  Atom["C", "HydrogenCount" -> 1], Atom["C", "HydrogenCount" -> 1], "C", "O", "C", "O", "N",
  ... ection" -> "Clockwise"],
    Association["StereoType" -> "Tetrahedral", "ChiralCenter" -> 29, "Direction" -> "Clockwise"],
    Association["StereoType" -> "DoubleBond", "StereoBond" -> {5, 6}, "Ligands" -> {4, 7},
     "Value" -> "Opposite"]}}]},
	Show[MoleculePlot3D[m, PlotTheme -> "Tubes"], MoleculeMesh[m, "Gaussian", BaseStyle -> Opacity[0.5]]
	]
]Text
Wolfram Research (2019), MoleculePlot3D, Wolfram Language function, https://reference.wolfram.com/language/ref/MoleculePlot3D.html (updated 2021).
CMS
Wolfram Language. 2019. "MoleculePlot3D." Wolfram Language & System Documentation Center. Wolfram Research. Last Modified 2021. https://reference.wolfram.com/language/ref/MoleculePlot3D.html.
APA
Wolfram Language. (2019). MoleculePlot3D. Wolfram Language & System Documentation Center. Retrieved from https://reference.wolfram.com/language/ref/MoleculePlot3D.html