

CategoricalHistogram
CategoricalHistogram[{c1,c2,…,cn}]
creates a histogram of the distinct categories in the list of categorical elements c1, c2, etc.
CategoricalHistogram[data,spec]
uses the specification spec to determine the categories.
CategoricalHistogram[data,spec,height]
uses the height value height to compare the bars.
CategoricalHistogram[{data1,data2,…},…]
plots histograms for multiple datasets datai.
Details
- CategoricalHistogram is also known as a one-way contingency table.
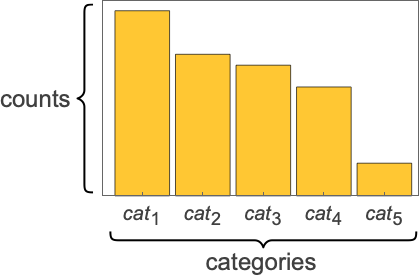
- CategoricalHistogram draws a rectangular bar showing the number of occurrences of each distinct category cat1, cat2, … among the elements ci in the data.
- Category elements ci can be any expression. They commonly have the following forms:
-
"name" string values Entity["type","ent"] Entity objects Nominal[{cat1,…,catk},ci] nominal category elements Ordinal[{cat1,…,catk},ci] ordinal category elements - Datasets datai have the following forms and interpretations:
-
{c1,c2,…} a list of elements ci <k1c1,k2c2,…> the values ci from the association <k1data,…> association of datasets TimeSeries,EventSeries,… the values from time series data WeightedData the count for each element is its weight w[datai] wrapper w for dataset datai - CategoricalHistogram[objcspec] extracts and plots values from the Tabular, TimeSeries or EventSeries object obj using the key specification cspec.
- The following specifications cspec are allowed for plotting tabular data:
-
k histogram elements from key k {k1,k2,…} histogram elements from keys k1,k2,… - The following category specifications spec can be given:
-
Automatic automatically determined bins {cat1,cat2,…} sequence of specific categories {cat1lab1,cat2lab2,…} sequence of categories cati with label labi NominalScale[…] categories from a nominal scale OrdinalScale[…] categories from an ordinal scale n use the n most common categories "Decreasing","Increasing" show largest or smallest categories first <"prop1"val1,"prop2"val2,…> use properties to choose the categories - By default, the bins for ordinal data are in ranked order. The bins for string, nominal and other data forms are in decreasing order of frequency.
- Possible categorization properties "propi" include:
-
"MaxCount" maximum number of categories to include "MinimumTotalFraction" minimum fraction of all data points to include "MinimumTotalCount" minimum count of all data points to include "MinimumBinFraction" include categories with at least the minimum fraction "MinimumBinCount" include categories with at least the minimum count "Categories" list of potential categories to include "CategoryLabels" labels to use for categories "RemainderCategory" name for data not included in other categories "CategoryOrdering" how to sort the categories - With <"MaxCount"n>, CategoricalHistogram will show the n largest categories.
- With <"MinimumFraction"f>, CategoricalHistogram will show enough categories so that the fraction f of the data is included. f should be between 0 and 1.
- The setting "CategoryLabels"{cat1lab1, ...} provides labels labi to use when displaying categories cati.
- The setting "RemainderCategory"other provides a label to use for categories that are omitted by settings for "MaxCount", "MinBinCount", etc.…
- Possible values for the setting "CategoryOrdering"order include:
-
Automatic use the default ordering "Decreasing" sort the categories from most common to least common "Increasing" sort the categories from least common to most common "Canonical" sort the categories using their canonical ordering None sort the categories in the order they were encountered - CategoricalHistogram has the same options as Graphics, with the following additions and changes: [List of all options]
-
AspectRatio 1/GoldenRatio ratio of height to width Axes True whether to draw axes BarOrigin Bottom origin placement for bars BarSpacing Automatic fractional spacing between bars ChartElementFunction Automatic how to generate raw graphics for bars ChartElements Automatic graphics to use in each of the bars ColorFunction Automatic how to color bars ColorFunctionScaling True whether to normalize arguments to ColorFunction Joined False whether to join bars LabelingFunction Automatic how to label bars LabelingSize Automatic maximum size of callouts and labels LegendAppearance Automatic overall appearance of legends PerformanceGoal $PerformanceGoal aspects of performance to try to optimize PlotLabels None labels to use for datasets PlotLayout Automatic overall layout to use PlotLegends None legends for data elements and datasets PlotStyle Automatic style for bars PlotTheme $PlotTheme overall theme for the chart ScalingFunctions None how to scale individual coordinates - Typical settings for PlotLegends include:
-
None no legend Automatic automatically determine legend {lbl1,lbl2,…} use lbl1, lbl2, … as legend labels Placed[lspec,…] specify placement for legend - PlotStylesty specifies the styles to use for each curve. Possible settings include:
-
{sty1,sty2,…} sequence of styles for the datasets <"key"val,…> styling elements for different levels of data - The accepted keys are:
-
"Base" overall style for all the datai "Lists" list of styles styi for each datai "Categories" list of style styi for each category cati - ColorData["DefaultChartColors"] gives the default sequence of colors used by PlotStyle.
- The following settings for PlotLayout can be used to display multiple sets of data:
-
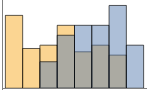
"Overlapped" show all the bins overlapping 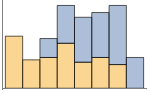
"Stacked" accumulate the counts per bin - Possible settings for PlotLayout that show single groups of bars in multiple chart panels include:
-
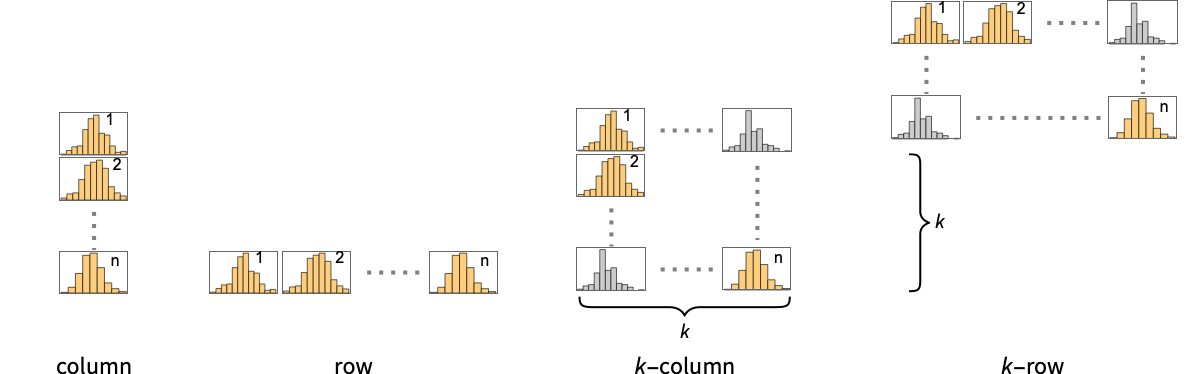
"Column" use separate groups of bars in a column of panels "Row" use separate groups of bars in a row of panels {"Column",k},{"Row",k} use k columns or rows {"Column",UpTo[k]},{"Row",UpTo[k]} use at most k columns or rows
List of all options
Examples
open all close allBasic Examples (7)
Generate a histogram for a list of categorical data:
CategoricalHistogram[IconizedObject[«Cylinders per car»]]CategoricalHistogram[{IconizedObject[«compact-class cylinders»], IconizedObject[«midsize-class cylinders»], IconizedObject[«subcompact-class cylinders»]}]Use "CategoryLabels" to rename some of the resulting categories:
data = <|"data one" -> <|"a" -> "dog", "b" -> "fish", "c" -> "fish", "d" -> "fish", "e" -> "cat", "f" -> "fish", "g" -> "cat", "h" -> "cat", "i" -> "fish", "j" -> "fish", "k" -> "fish", "l" -> "fish", "m" -> "fish"|>, "data two" -> <|"a" -> "cat", "b" -> "fish", "c" -> "cat", "d" -> "dog", "e" -> "cat", "f" -> "cat", "g" -> "cat", "h" -> "fish", "i" -> "cat", "j" -> "dog", "k" -> "cat", "l" -> "cat", "m" -> "cat"|>|>;CategoricalHistogram[data, <|"CategoryLabels" -> <|"cat" -> "CAT", "dog" -> "DOG"|>|>]For individual data, set the style for each of the bars:
CategoricalHistogram[IconizedObject[«Cylinders per car»], PlotStyle -> "DarkRainbow"]in case of multiple datasets, the style set is based on the dataset where categories come from:
CategoricalHistogram[{IconizedObject[«compact-class cylinders»], IconizedObject[«midsize-class cylinders»], IconizedObject[«subcompact-class cylinders»]}, PlotStyle -> "DarkRainbow"]Use PlotStyle{style,None} to use the color scheme per category instead:
CategoricalHistogram[{IconizedObject[«compact-class cylinders»], IconizedObject[«midsize-class cylinders»], IconizedObject[«subcompact-class cylinders»]}, PlotStyle -> {"DarkRainbow", None}]CategoricalHistogram[IconizedObject[«Cylinders per car»], ChartElements -> [image]]Table[CategoricalHistogram[{IconizedObject[«compact-class cylinders»], IconizedObject[«midsize-class cylinders»], IconizedObject[«subcompact-class cylinders»]}, PlotLabel -> l, ChartLayout -> l], {l, {"Percentile", "Stacked"}}]Scope (28)
Data and Layouts (15)
Which bins to use is automatically determined:
CategoricalHistogram[IconizedObject[«Cars per fuel type»]]Specify which categories/bins to use:
CategoricalHistogram[IconizedObject[«Cars per fuel type»], {"r", "p", "e"}]Specify how many categories to use:
CategoricalHistogram[IconizedObject[«Cars per fuel type»], 4]Sort categories on the chart based on the values:
CategoricalHistogram[IconizedObject[«Cars per fuel type»], <|"CategoryOrdering" -> "Increasing"|>]Sort categories on the chart based on category names:
CategoricalHistogram[IconizedObject[«Cars per fuel type»], <|"CategoryOrdering" -> "Alphabetic"|>]Show just categories whose counts meet a minimum count threshold of 50:
CategoricalHistogram[IconizedObject[«Cars per fuel type»], <|"MinimumBinCount" -> 50|>]Show just categories whose counts meet a minimum percentage threshold of 22 percent:
CategoricalHistogram[IconizedObject[«Cars per fuel type»], <|"MinimumBinFraction" -> .22|>]Take categories using the default ordering until a minimum total percentage threshold is obtained:
CategoricalHistogram[IconizedObject[«Cars per fuel type»], <|"MinimumTotalFraction" -> .95|>]Take categories using a specific ordering until at least a minimum total percentage of 5 percent threshold is met:
CategoricalHistogram[IconizedObject[«Cars per fuel type»], <|"CategoryOrdering" -> "Increasing", "MinimumTotalFraction" -> .05|>]Change labels for specific categories:
CategoricalHistogram[IconizedObject[«Cars per fuel type»], <|"CategoryLabels" -> <|"c" -> "Label 1", "d" -> "Label 2"|>|>]Data that belongs to the same datasets across categories is styled the same:
CategoricalHistogram[{IconizedObject[«compact-class cylinders»], IconizedObject[«midsize-class cylinders»], IconizedObject[«subcompact-class cylinders»]}, PlotLegends -> Automatic]CategoricalHistogram[<|"compact" -> IconizedObject[«compact-class cylinders»], "midsize" -> IconizedObject[«midsize-class cylinders»], "Subcompact" -> IconizedObject[«subcompact-class cylinders»]|>]data = <|"data one" -> <|"a" -> "dog", "b" -> "fish", "c" -> "fish", "d" -> "fish", "e" -> "cat", "f" -> "fish", "g" -> "cat", "h" -> "cat", "i" -> "fish", "j" -> "fish", "k" -> "fish", "l" -> "fish", "m" -> "fish"|>, "data two" -> <|"a" -> "cat", "b" -> "fish", "c" -> "cat", "d" -> "dog", "e" -> "cat", "f" -> "cat", "g" -> "cat", "h" -> "fish", "i" -> "cat", "j" -> "dog", "k" -> "cat", "l" -> "cat", "m" -> "cat"|>|>;CategoricalHistogram[data]CategoricalHistogram[data, ChartLegends -> Automatic]Use different layouts to display multiple datasets:
Table[CategoricalHistogram[{IconizedObject[«compact-class cylinders»], IconizedObject[«midsize-class cylinders»], IconizedObject[«subcompact-class cylinders»]}, PlotLabel -> l, ChartLayout -> l], {l, {"Percentile", "Stacked"}}]CategoricalHistogram[{IconizedObject[«compact-class cylinders»], IconizedObject[«midsize-class cylinders»], IconizedObject[«subcompact-class cylinders»]}, PlotLabel -> "Overlapped", ChartLayout -> "Overlapped"]Use rows and columns of individual plots to show multiple sets:
CategoricalHistogram[{IconizedObject[«compact-class cylinders»], IconizedObject[«midsize-class cylinders»], IconizedObject[«subcompact-class cylinders»]}, ChartLayout -> "Column"]data = {"Cat", "Dog", "Rabbit", "Cat", "Rabbit", "Bird", "Rabbit", "Dog", "Dog", "Dog"};
Table[CategoricalHistogram[data, BarOrigin -> o, PlotLabel -> o, ImageSize -> Small], {o, {Bottom, Left, Top, Right}}]Tabular Data (1)
Get tabular data, with information about Titanic passengers, class and sex:
titanic = ToTabular[ResourceData["Sample Data: Titanic Survival"]]Create a Histogram for class of passengers:
CategoricalHistogram[titanic -> "Class"]See the counts of passengers grouped by Class and Sex:
groupdata = GroupBy[titanic, #Class&, Normal[#[All, "Sex"]]&];CategoricalHistogram[groupdata, ChartLegends -> Automatic]Use stacked bars for the display:
CategoricalHistogram[groupdata, ChartLegends -> Automatic, ChartLayout -> "Stacked"]Wrappers (1)
Styling and Appearance (5)
Use an explicit style list for each category bin of the data:
CategoricalHistogram[IconizedObject[«Male Palmer Penguins Species»], PlotStyle -> 60]Use explicit color types that belong to the same dataset:
CategoricalHistogram[{IconizedObject[«Female Palmer Penguins Species»], IconizedObject[«Male Palmer Penguins Species»]}, PlotStyle -> {Red, Green}]Use any gradient or indexed color schemes from ColorData:
{CategoricalHistogram[{IconizedObject[«Female Palmer Penguins Species»], IconizedObject[«Male Palmer Penguins Species»]}, PlotStyle -> "Pastel"], CategoricalHistogram[{IconizedObject[«Female Palmer Penguins Species»], IconizedObject[«Male Palmer Penguins Species»]}, PlotStyle -> {"Pastel", None}]}ChartBaseStyle can be used to set an initial style for all chart elements:
CategoricalHistogram[{IconizedObject[«Female Palmer Penguins Species»], IconizedObject[«Male Palmer Penguins Species»]}, ChartBaseStyle -> EdgeForm[Dotted]]Use any graphic for pictorial bars:
CategoricalHistogram[IconizedObject[«Male Palmer Penguins Species»], ChartElements -> Graphics[{Red, Circle[]}]]Use built-in, programmatically generated bars:
ChartElementData["Histogram"]Table[CategoricalHistogram[IconizedObject[«Male Palmer Penguins Species»], ChartElementFunction -> f], {f, {"GlassRectangle", "GradientScaleRectangle"}}]For detailed settings, use Palettes ▶ ChartElementSchemes:
CategoricalHistogram[IconizedObject[«Male Palmer Penguins Species»], ChartElementFunction -> ChartElementDataFunction["SegmentScaleRectangle", "Segments" -> 7, "ColorScheme" -> "SolarColors"]]CategoricalHistogram[IconizedObject[«Male Palmer Penguins Species»], PlotTheme -> "Monochrome"]Labeling and Legending (6)
Provide value labels for bars by using LabelingFunction:
CategoricalHistogram[IconizedObject[«compact-class cylinders»], LabelingFunction -> Above]ChartElements may override settings for PlotStyle:
CategoricalHistogram[IconizedObject[«compact-class cylinders»], ChartElements -> [image], PlotStyle -> {RGBColor[0.93, 0.27, 0.27], RGBColor[0.14, 0.8, 0.14], RGBColor[0.4, 0.6, 1]}]Use Placed within a custom function to control placement and formatting:
labeler[v_, {i_, j_}, {ri_, cj_}] := Placed[{StringJoin[ToString[First@cj], "-cyl"], v}, Above, Column]CategoricalHistogram[IconizedObject[«compact-class cylinders»], LabelingFunction -> labeler]Add categorical legend entries for categories:
CategoricalHistogram[IconizedObject[«compact-class cylinders»], ChartLegends -> {"Cat1", "Cat2", "Cat3"}, PlotStyle -> "Pastel"]Use Association based PlotStyle to indicate categories
CategoricalHistogram[IconizedObject[«compact-class cylinders»], ChartLegends -> {"Cat1", "Cat2", "Cat3"}, PlotStyle -> <|"Categories" -> "Pastel"|>]CategoricalHistogram[{IconizedObject[«compact-class cylinders»], IconizedObject[«midsize-class cylinders»], IconizedObject[«subcompact-class cylinders»]}, PlotStyle -> <|"Categories" -> "Pastel"|>, PlotLegends -> <|"Categories" -> {"Cat1", "Cat2", "Cat3"}|>]Add categorical legend entries for datasets:
CategoricalHistogram[{IconizedObject[«compact-class cylinders»], IconizedObject[«midsize-class cylinders»], IconizedObject[«subcompact-class cylinders»]}, ChartLegends -> {"Dataset1", "Dataset2", "Dataset3"}, PlotStyle -> "Pastel"]CategoricalHistogram[{IconizedObject[«compact-class cylinders»], IconizedObject[«midsize-class cylinders»], IconizedObject[«subcompact-class cylinders»]}, PlotStyle -> <|"Lists" -> "Pastel"|>, PlotLegends -> <|"Lists" -> {"Dataset1", "Dataset2", "Dataset3"}|>]Use Placed to affect the positioning of legends:
Table[CategoricalHistogram[{IconizedObject[«compact-class cylinders»], IconizedObject[«midsize-class cylinders»], IconizedObject[«subcompact-class cylinders»]}, ChartLegends -> Placed[{"ccc1", "ccc2", "ccc3"}, p], PlotStyle -> "Pastel"], {p, {Below, Above}}]Applications (5)
Analyze the prevalence of mushrooms across different habitats with some of its properties:
table = ToTabular[ResourceData["Sample Data: Mushroom Classification"]]Generate a histogram to see the edible quality of the mushrooms in the dataset:
CategoricalHistogram[table -> "Class"]Use GroupBy to split the data per habitat and if whether they are edible or not:
classperhabitat = GroupBy[table, #Class&, Normal[#[All, "Habitat"]]&];
CategoricalHistogram[classperhabitat, BarSpacing -> {Automatic, 3.5}, PlotLegends -> Automatic]
For cases when categories are too large, use LabelingSize to display just a portion of the category:
CategoricalHistogram[classperhabitat, BarSpacing -> {Automatic, 4}, PlotLegends -> Automatic, AspectRatio -> 1 / 2, LabelingSize -> 32]Display the counts of diamonds by cut:
tabulardata = ResourceData["Sample Tabular Data: Diamonds"];CategoricalHistogram[tabulardata -> "cut"]Use GroupBy and CategoricalHistogram to display diamonds' counts of cuts split by color:
groupdata = GroupBy[tabulardata, #cut&, Normal[#[All, "color"]]&];CategoricalHistogram[groupdata, ChartLegends -> Automatic]Use "MinimumBinFraction" to show just categories whose counts represent at least 15% of the total counts:
CategoricalHistogram[groupdata, <|"MinimumBinFraction" -> .15|>, ChartLegends -> Automatic]Use "MaxCount" to emphasize the biggest categories with "RemainderCategory" to put all other elements into a single generic group:
CategoricalHistogram[groupdata, <|"MaxCount" -> 2|>, ChartLegends -> Automatic]Add "RemainderCategory" to put all the discarded elements into a single generic group, while keeping the original elements selected by "MaxCount":
CategoricalHistogram[groupdata, <|"MaxCount" -> 2, "RemainderCategory" -> "Others"|>, ChartLegends -> Automatic]Display the number of penguins in the Palmer Penguins dataset, grouped by island:
tab = ResourceData["Sample Tabular Data: Palmer Penguins"];
data = GroupBy[tab, #sex&, Normal[#[All, "species"]]&];CategoricalHistogram[data, ChartLegends -> Automatic]Compare the gender of patients who received a kidney transplant:
kidneydata = ToTabular[ResourceData["Sample Data: Kidney Transplant"]];
CategoricalHistogram[kidneydata -> "Gender", ChartLegends -> Automatic]
Compare the data of patients who received a kidney transplant by gender and race:
kidneydatabygenderandrace = GroupBy[kidneydata, #Gender&, Normal[#[All, "Race"]]&];
CategoricalHistogram[kidneydatabygenderandrace, ChartLegends -> Automatic]
Analyze from the tree census dataset the type of category of user who collected tree data:
NYCTrees = ResourceData["Sample Tabular Data: NYC Trees"];CategoricalHistogram[NYCTrees -> "user_type", BarSpacing -> 2]Compare the category of user per borough:
NYCTreesbyusertype = GroupBy[NYCTrees, #"user_type"&, Normal[#[All, "borough"]]&];CategoricalHistogram[NYCTreesbyusertype, BarSpacing -> {Automatic, 4}, PlotLegends -> Automatic]Text
Wolfram Research (2026), CategoricalHistogram, Wolfram Language function, https://reference.wolfram.com/language/ref/CategoricalHistogram.html.
CMS
Wolfram Language. 2026. "CategoricalHistogram." Wolfram Language & System Documentation Center. Wolfram Research. https://reference.wolfram.com/language/ref/CategoricalHistogram.html.
APA
Wolfram Language. (2026). CategoricalHistogram. Wolfram Language & System Documentation Center. Retrieved from https://reference.wolfram.com/language/ref/CategoricalHistogram.html