


ConvexHullRegion
ConvexHullRegion[{p1,p2,…}]
gives the convex hull from the points p1, p2, ….
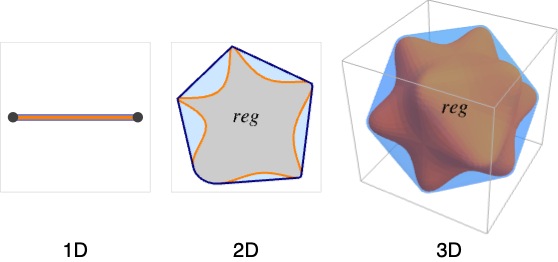
ConvexHullRegion[reg]
gives the convex hull of the region reg.
Details and Options
- ConvexHullRegion is also known as convex envelope or convex closure.
- The convex hull mesh is the smallest convex set that includes the points pi.
- The convex hull of a region reg is the smallest set that contains every line segment between two points in the region reg.
- ConvexHullRegion takes the same options as Region.
Examples
open all close allBasic Examples (3)
A 2D convex hull mesh from points:
pts = RandomReal[{-1, 1}, {50, 2}];ℛ = ConvexHullRegion[pts]The region is the smallest convex region that includes the points:
Region[ℛ, Epilog -> {Black, Point[pts]}]A convex hull region of an annulus:
ℛ = Annulus[{0, 0}, {1 / 2, 1}, {0, 3Pi / 2}];ConvexHullRegion[ℛ]Visualize the annulus and its convex hull:
{Region[ℛ], Region[%]}The convex hull of a mesh region:
mr = ExampleData[{"Geometry3D", "Cow"}, "MeshRegion"]ℛ = ConvexHullRegion[mr];The convex hull contains every line segment between two points of the region:
Show[HighlightMesh[ℛ, Style[2, Opacity[0.5]]], mr]Scope (20)
Points (1)
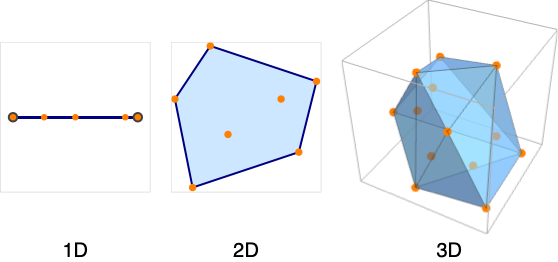
Create a 1D convex hull region from a set of points:
pts = RandomReal[{-1, 1}, {50, 1}];ℛ = ConvexHullRegion[pts]pts = RandomReal[{-1, 1}, {50, 2}];ℛ = ConvexHullRegion[pts]pts = RandomReal[{-1, 1}, {50, 3}];ℛ = ConvexHullRegion[pts]Special Regions (4)
Regions in ![]() including Point:
including Point:
ConvexHullRegion[Point[{1}]]ℛ = Interval[{1, 2}];
Region[ℛ]ConvexHullRegion[ℛ]Line:
ConvexHullRegion[Line[{{1}, {2}}]]Regions in ![]() including Point:
including Point:
ℛ = Point[Table[{t, Sin[t]}, {t, 0, 2π, 2π / 10}]];
Region[ℛ]ConvexHullRegion[ℛ]Line:
ℛ = Line[{{1, 0}, {2, 1}, {3, 0}, {4, 1}}];
Region[ℛ]ConvexHullRegion[ℛ]ℛ = Polygon[{{0, 0}, {1, 0}, {0.2, 1}, {0.9, 1}}]ConvexHullRegion[ℛ]ℛ = Circle[{1, 2}, 3];
Region[ℛ]ConvexHullRegion[ℛ]Disk:
ℛ = Disk[{0, 0}, {3, 4}, {1, 1 + 5}];
Region[ℛ]ConvexHullRegion[ℛ]Regions in ![]() including Point:
including Point:
ℛ = Point[Tuples[Range[2], 3]];
Region[ℛ]ConvexHullRegion[ℛ]Line:
ℛ = Line[{{1, 2, 3}, {6, 5, 4}, {3, 4, 7}}];
Region[ℛ]ConvexHullRegion[ℛ]ℛ = Polygon[Table[{Cos[2π k / 6], Sin[2π k / 6], 0}, {k, 0, 5}], {Range[6]}]ConvexHullRegion[ℛ]r = Prism[{{{1, 0, 1}, {0, 0, 0}, {2, 0, 0}, {1, 2, 1}, {0, 2, 0}, {2, 2, 0}}, {{3, 2, 3}, {2, 2, 2}, {4, 2, 2}, {3, 4, 3}, {2, 4, 2}, {4, 4, 2}}}];ℛ = Prism[{{{1, 0, 1}, {0, 0, 0}, {2, 0, 0}, {1, 2, 1}, {0, 2, 0}, {2, 2, 0}}, {{3, 2, 3}, {2, 2, 2}, {4, 2, 2}, {3, 4, 3}, {2, 4, 2}, {4, 4, 2}}}];
Region[ℛ]ConvexHullRegion[ℛ]Regions in ![]() including Simplex in
including Simplex in ![]() :
:
ConvexHullRegion[Simplex[{{1, 0, 0, 0}, {0, 1, 0, 0}, {0, 0, 1, 0}, {0, 0, 0, 1}}]]Cuboid in ![]() :
:
ConvexHullRegion[Cuboid[{1, 2, 3, 4, 5}, {6, 7, 8, 9, 10}]]Ball in ![]() :
:
ConvexHullRegion[Ball[{1, 2, 3, 4, 5, 6, 7}, 8]]Mesh Regions (2)
MeshRegion in 1D:
MeshRegion[{{0}, {1}, {5}}, Line[{1, 2, 3}]]ConvexHullRegion[%]MeshRegion[{{0, 0}, {2, 0}, {3, 1}, {2, 3}, {1, 2}}, Polygon[{1, 3, 2, 4, 5}]]ConvexHullRegion[%]MengerMesh[1, 3]ConvexHullRegion[%]BoundaryMeshRegion in 1D:
BoundaryMeshRegion[{{0}, {1}}, Point[{1, 2}]]ConvexHullRegion[%]BoundaryMeshRegion[{{0, 0}, {1, 3}, {0, 1}, {-1, 0}}, Line[{1, 2, 3, 4, 1}]]ConvexHullRegion[%]ℛ = [image];ConvexHullRegion[%]Formula Regions (3)
A parabolic region as an ImplicitRegion:
ℛ = ImplicitRegion[x + 3y ≤ 3 && 2x + y ≥ 1, {x, y}];Region[ℛ]ConvexHullRegion[ℛ]A parabola represented as a ParametricRegion:
ℛ = ParametricRegion[{t, t^2}, {t}];Region[ℛ]ConvexHullRegion[ℛ]ImplicitRegion can have several components of different dimensions:
ℛ = ImplicitRegion[x^2 + y^2 ≤ 1∨(x + 1)^2 + y^2 == 1, {x, y}];Region[ℛ]ConvexHullRegion[ℛ]Derived Regions (6)
RegionIntersection of two regions:
ℛ = RegionIntersection[Disk[{0, 0}, 1], Disk[{0, 1}, 1]];Region[ℛ]ConvexHullRegion[ℛ]RegionUnion of mixed-dimensional regions:
ℛ = RegionUnion[Circle[{0, 0}, 1], Disk[{2, 0}, 1]];Region[ℛ]ConvexHullRegion[ℛ]General BooleanRegion combination:
ℛ = BooleanRegion[Xor, {Disk[{-1 / 3, 0}, 1], Disk[{1 / 3, 0}, 1]}];
Region[ℛ]ConvexHullRegion[ℛ]ℛ = TransformedRegion[Disk[], {Indexed[#1, 1] + Indexed[#1, 2], Indexed[#1, 1] - Indexed[#1, 2], Indexed[#1, 1] Indexed[#1, 2]}& ];Region[ℛ]ConvexHullRegion[ℛ]ℛ = InverseTransformedRegion[Disk[], {Indexed[#1, 1] + Indexed[#1, 2] + Indexed[#1, 3], Indexed[#1, 1] Indexed[#1, 2]Indexed[#1, 3]}& , 3];Region[%]ConvexHullRegion[ℛ]ℛ = RegionBoundary[Ball[]];ConvexHullRegion[ℛ]Geographic Regions (2)
The convex hull region of a polygon with GeoPosition:
ℛ = Polygon[GeoPosition[{{{40.083441, -88.235716}, {40.083607, -88.257488}, {40.082603, -88.257149},
   {40.076136999999996, -88.25740499999999}, {40.076178, -88.270888}, {40.076516, -88.271558},
   {40.083686, -88.271512}, {40.083659999999995, -88.267046},  ... 33323}, {40.098112, -88.228687},
   {40.095216, -88.228627}, {40.095179, -88.238547}, {40.094480999999995, -88.238546},
   {40.094508999999995, -88.23267}, {40.094106, -88.232556}, {40.090666999999996, -88.232477},
{40.090741, -88.235745}}}]];ConvexHullRegion[ℛ]The convex hull region of a polygon with GeoGridPosition:
ℛ = Polygon[GeoGridPosition[{{{-0.9950503945490105, 1.2366760550756015},
   {-0.9952074890903578, 1.2369207053693891}, {-0.9952196732768064, 1.2369073327446167},
   {-0.9953160063787643, 1.236848436956935}, {-0.9954141759436825, 1.2369993898475449},
   {-0. ... 197645333103}, {-0.9949098578570917, 1.2368130881428654},
   {-0.9948663952535768, 1.2367477711687371}, {-0.9948714472169538, 1.2367426500757825},
{-0.9949211061652593, 1.2367089232486177}, {-0.9949439717990124, 1.236746107097628}}}, "Bonne"]];ConvexHullRegion[ℛ]CSG Regions (1)
CSGRegion in 2D:
CSGRegion["Difference", {Disk[], Disk[{0, 0}, 1 / 2]}]ConvexHullRegion[%]CSGRegion["Difference", {Cube[2], Cylinder[{{0, 1, 0}, {0, -1, 0}}, 1 / 2]}]ConvexHullRegion[%]Subdivision Regions (1)
SubdivisionRegion in 2D:
SubdivisionRegion[[image]]ConvexHullRegion[%]SubdivisionRegion[[image]]ConvexHullRegion[%]Options (97)
AlignmentPoint (1)
Specify the position to be aligned in 3D Inset, using ![]() coordinates:
coordinates:
Table[Graphics[{Inset[ConvexHullRegion[Triangle[{{0, 0}, {2, -1}, {2, 1}}], AlignmentPoint -> {a, 0}], {0, 0}]}, ImageSize -> 100, Axes -> True, Ticks -> None], {a, {0, 1 / 2, 1}}]Table[Graphics[{Inset[ConvexHullRegion[Triangle[{{0, 0}, {2, -1}, {2, 1}}], AlignmentPoint -> {1 / 2, a}], {0, 0}]}, ImageSize -> 100, Axes -> True, Ticks -> None], {a, {0, 1 / 2, 1}}]AspectRatio (1)
Use numerical values for AspectRatio:
Table[ConvexHullRegion[Triangle[{{0, 0}, {2, -1}, {2, 1}}], AspectRatio -> 1 / k], {k, 1, 3}]Axes (2)
AxesEdge (2)
Choose the bounding box edges automatically to draw the axes:
ConvexHullRegion[Pyramid[], Boxed -> True, Axes -> True, AxesEdge -> Automatic]Choose the bounding box edges automatically to draw the axes:
ConvexHullRegion[Pyramid[], Boxed -> True, Axes -> True, AxesEdge -> {{1, 1}, None, None}]AxesLabel (2)
AxesOrigin (2)
Determine where the axes cross automatically:
ConvexHullRegion[Triangle[{{0, 0}, {2, -1}, {2, 1}}], Axes -> True, AxesOrigin -> Automatic]Specify the axes' origin explicitly:
ConvexHullRegion[Triangle[{{0, 0}, {2, -1}, {2, 1}}], Axes -> True, AxesOrigin -> {0, -1}]AxesStyle (2)
Specify the overall axes style, including the ticks and the tick labels:
ConvexHullRegion[Triangle[{{0, 1}, {2, 0}, {2, 2}}], Axes -> True, AxesStyle -> Directive[Orange, 12]]Specify the style of each axis:
ConvexHullRegion[Triangle[{{0, 1}, {2, 0}, {2, 2}}], Axes -> True, AxesStyle -> {Directive[Dashed, Red], Blue}]Background (1)
BaselinePosition (3)
Align the center of a graphic with the baseline of the text:
{x, ConvexHullRegion[Triangle[{{0, 1}, {2, 0}, {2, 2}}], ImageSize -> 50, BaselinePosition -> Center], y}Specify the baseline of a graphic as a fraction of the height by using Scaled:
Table[{x, ConvexHullRegion[Triangle[{{0, 1}, {2, 0}, {2, 2}}], ImageSize -> 50, BaselinePosition -> Scaled[b]]}, {b, {0, 0.5, 1}}]Use the axis of a graphic as the baseline:
{x, ConvexHullRegion[Triangle[{{0, 1}, {2, 0}, {2, 2}}], ImageSize -> 50, BaselinePosition -> Axis], y}BaseStyle (2)
Boxed (2)
Draw the edges of the bounding box:
ConvexHullRegion[Pyramid[{{0, 0, 0}, {2, 0, 0}, {2, 2, 0}, {0, 2, 0}, {1, 1, 2}}], Boxed -> True]Do not draw the edges of the bounding box:
ConvexHullRegion[Pyramid[{{0, 0, 0}, {2, 0, 0}, {2, 2, 0}, {0, 2, 0}, {1, 1, 2}}], Boxed -> False]BoxRatios (2)
Specify the ratios between the bounding box edges:
ConvexHullRegion[Pyramid[{{0, 0, 0}, {2, 0, 0}, {2, 2, 0}, {0, 2, 0}, {1, 1, 2}}], Boxed -> True, BoxRatios -> {1, 2, 3}]Use the actual coordinate values for the ratios:
ConvexHullRegion[Pyramid[{{0, 0, 0}, {2, 0, 0}, {2, 2, 0}, {0, 2, 0}, {1, 1, 2}}], Boxed -> True, Axes -> True, BoxRatios -> Automatic]BoxStyle (1)
Epilog (1)
FaceGrids (4)
Put grids on every face of a 3D graphic:
ConvexHullRegion[Pyramid[{{0, 0, 0}, {2, 0, 0}, {2, 2, 0}, {0, 2, 0}, {1, 1, 2}}], Axes -> True, Boxed -> True, FaceGrids -> All]ConvexHullRegion[Pyramid[{{0, 0, 0}, {2, 0, 0}, {2, 2, 0}, {0, 2, 0}, {1, 1, 2}}], Axes -> True, Boxed -> True, FaceGrids -> {{0, 0, 1}, {0, 0, -1}}]ConvexHullRegion[Pyramid[{{0, 0, 0}, {2, 0, 0}, {2, 2, 0}, {0, 2, 0}, {1, 1, 2}}], Axes -> True, Boxed -> True, FaceGrids -> {{0, -1, 0}}]On the ![]() plane, put grid lines on
plane, put grid lines on ![]() ,
, ![]() and
and ![]() :
:
ConvexHullRegion[Pyramid[{{0, 0, 0}, {2, 0, 0}, {2, 2, 0}, {0, 2, 0}, {1, 1, 2}}], Axes -> True, Boxed -> True, FaceGrids -> {{{0, -1, 0}, {{1}, {2 / 3, 4 / 3}}}}]FaceGridsStyle (1)
Frame (2)
FrameLabel (2)
FrameStyle (2)
Specify the overall frame style:
ConvexHullRegion[Triangle[{{0, 1}, {2, 0}, {2, 2}}], Frame -> True, FrameStyle -> Directive[Thick, Gray]]Specify the style of each frame edge:
ConvexHullRegion[Triangle[{{0, 1}, {2, 0}, {2, 2}}], Frame -> True, FrameStyle -> {{Thick, Directive[Thick, Dashed]}, {Blue, Red}}]FrameTicks (3)
ConvexHullRegion[Triangle[{{0, 1}, {2, 0}, {2, 2}}], Frame -> True, FrameTicks -> None]Tick mark labels on the bottom and left frame edges:
ConvexHullRegion[Triangle[{{0, 1}, {2, 0}, {2, 2}}], Frame -> True, FrameTicks -> Automatic]Frame ticks on the bottom and right edges:
ConvexHullRegion[Triangle[{{0, 1}, {2, 0}, {2, 2}}], Frame -> True, FrameTicks -> {{None, Automatic}, {Automatic, None}}]FrameTicksStyle (2)
Specify frame tick and frame tick label style:
ConvexHullRegion[Triangle[{{0, 1}, {2, 0}, {2, 2}}], Frame -> True, FrameTicksStyle -> Directive[Orange, 12]]Specify frame tick style for each edge:
ConvexHullRegion[Triangle[{{0, 1}, {2, 0}, {2, 2}}], Frame -> True, FrameTicksStyle -> {{Green, Blue}, {Red, Green}}]GridLines (3)
Put grids across a 2D graphic:
Region[Triangle[{{0, 1}, {2, 0}, {2, 2}}], GridLines -> Automatic]Draw grid lines at specific positions:
Region[Triangle[{{0, 1}, {2, 0}, {2, 2}}], Axes -> True, GridLines -> {{.5, 1.5}, {.5, 1.5}}]Specify the style of each grid:
Region[Triangle[{{0, 1}, {2, 0}, {2, 2}}], Axes -> True, GridLines -> {{{-1, Orange}, {-.5, Dotted}, {.5, Dotted}, {1, Orange}}, {-1, {-.5, Dotted}, {.5, Dotted}, 1}}]GridLinesStyle (1)
ImageMargins (3)
Allow no margins outside of ImageSize:
Framed[Region[Triangle[{{0, 1}, {2, 0}, {2, 2}}]]]Have 20-point margins on all sides:
Framed[Region[Triangle[{{0, 1}, {2, 0}, {2, 2}}], ImageMargins -> 20]]Draw grid lines at specific positions:
Framed[Region[Triangle[{{0, 1}, {2, 0}, {2, 2}}], ImageMargins -> {{5, 10}, {20, 30}}]]ImagePadding (4)
Leave no padding outside the plot range:
Region[Triangle[{{0, 1}, {2, 0}, {2, 2}}], ImagePadding -> None, Frame -> True, FrameLabel -> {x, y}]Leave enough padding for all objects and labels that are present:
Framed[Region[Triangle[{{0, 1}, {2, 0}, {2, 2}}], ImagePadding -> All, Frame -> True, FrameLabel -> {x, y}], FrameMargins -> 0]Specify the same padding for all sides in printer's points:
Framed[Region[Triangle[{{0, 1}, {2, 0}, {2, 2}}], ImagePadding -> 40, Frame -> True]]Specify the same padding for all sides in printer's points:
Framed[Region[Triangle[{{0, 1}, {2, 0}, {2, 2}}], ImagePadding -> {{40, 10}, {20, 5}}, Frame -> True]]ImageSize (3)
Use predefined symbolic sizes:
Table[Region[Triangle[{{0, 1}, {2, 0}, {2, 2}}], ImageSize -> s], {s, {Tiny, Small}}]{Region[Triangle[{{0, 1}, {2, 0}, {2, 2}}], ImageSize -> 100], Region[Triangle[{{0, 2}, {2, 0}, {2, 4}}], ImageSize -> 100]}Use an explicit image width and height:
{Region[Triangle[{{0, 1}, {2, 0}, {2, 2}}], ImageSize -> {100, 100}], Region[Triangle[{{0, 2}, {2, 0}, {2, 4}}], ImageSize -> {100, 100}]}LabelStyle (1)
Lighting (4)
Ambient light is uniformly applied to all the surfaces in the scene:
Region[Pyramid[{{0, 0, 0}, {2, 0, 0}, {2, 2, 0}, {0, 2, 0}, {1, 1, 2}}], Lighting -> {{"Ambient", Orange}}]Directional lights with different colors:
Table[Region[Pyramid[{{0, 0, 0}, {2, 0, 0}, {2, 2, 0}, {0, 2, 0}, {1, 1, 2}}], Lighting -> {{"Directional", c, {{1.5, 0, 2}, {0, 0, 0}}}}], {c, {Red, Yellow, Blue}}]Point lights with different colors:
Table[Region[Pyramid[{{0, 0, 0}, {2, 0, 0}, {2, 2, 0}, {0, 2, 0}, {1, 1, 2}}], Lighting -> {{"Point", c, {1.5, 0, 3}}}], {c, {Red, Yellow, Blue}}]Spotlights with different colors:
Table[Region[Pyramid[{{0, 0, 0}, {2, 0, 0}, {2, 2, 0}, {0, 2, 0}, {1, 1, 2}}], Lighting -> {{"Spot", c, {{1, 1, 2.5}, {1, 1, 2}}, Pi / 8}}], {c, {Red, Yellow, Blue}}]PlotLabel (2)
Display a label on the top of the graphic in TraditionalForm:
Region[Triangle[{{0, 1}, {2, 0}, {2, 2}}], PlotLabel -> x ^ 2 + y ^ 2 == 1]Use Style and other typesetting functions to modify how the label appears:
Region[Triangle[{{0, 1}, {2, 0}, {2, 2}}], PlotLabel -> Style[Framed[x ^ 2 + y ^ 2 == 1], 16, Red, Background -> Yellow]]PlotRange (3)
Region[Triangle[{{0, 1}, {2, 0}, {2, 2}}], Frame -> True, PlotRange -> All]Region[Triangle[{{-1, 0}, {1, -1}, {1, 1}}], PlotRange -> {{-1, 1}, {0, 1}}, Frame -> True]Force clipping at the PlotRange:
Region[Triangle[{{-1, 0}, {1, -1}, {1, 1}}], PlotRange -> {{-1, 1}, {0, 1}}, PlotRange -> {{-1, 1}, {0, 1}}, PlotRangeClipping -> True, Frame -> True]PlotRange->s is equivalent to PlotRange->{{-s,s},{-s,s}}:
Region[Triangle[{{-2, 0}, {2, -2}, {2, 2}}], Frame -> True, PlotRange -> 1]PlotRangeClipping (2)
Allow graphics objects to spread beyond PlotRange:
Region[Triangle[{{-2, 0}, {2, -2}, {2, 2}}], Frame -> True, PlotRange -> 1, PlotRangeClipping -> False]Clip all graphics objects at PlotRange:
Region[Triangle[{{-2, 0}, {2, -2}, {2, 2}}], Frame -> True, PlotRange -> 1, PlotRangeClipping -> True]PlotRangePadding (3)
Include 1 coordinate unit of padding on all sides:
Region[Triangle[{{0, 1}, {2, 0}, {2, 2}}], PlotRangePadding -> 1, Frame -> True]Include padding using Scaled coordinates:
Region[Triangle[{{0, 1}, {2, 0}, {2, 2}}], PlotRangePadding -> Scaled[0.1], Frame -> True]Specify different padding on each side:
Region[Triangle[{{0, 1}, {2, 0}, {2, 2}}], PlotRangePadding -> {{0.5, 1}, {0.3, 0.3}}, Frame -> True]PlotRegion (3)
The contents of a graphic use the whole region:
Region[Triangle[{{0, 1}, {2, 0}, {2, 2}}], Frame -> True, FrameTicks -> False, Background -> LightBlue]Limit the contents of the graphic to the middle half of the region in each direction:
Region[Triangle[{{0, 1}, {2, 0}, {2, 2}}], Frame -> True, FrameTicks -> False, PlotRegion -> {{0.25, 0.75}, {0.25, 0.75}}, Background -> LightBlue]ImagePadding can also be used to add padding around a graphic:
Region[Triangle[{{0, 1}, {2, 0}, {2, 2}}], Frame -> True, FrameTicks -> False, ImagePadding -> 30, Background -> LightBlue]PlotTheme (3)
Base themes (2)
ConvexHullRegion[Pyramid[{{0, 0, 0}, {2, 0, 0}, {2, 2, 0}, {0, 2, 0}, {1, 1, 2}}], PlotTheme -> "Detailed"]ConvexHullRegion[Pyramid[{{0, 0, 0}, {2, 0, 0}, {2, 2, 0}, {0, 2, 0}, {1, 1, 2}}], PlotTheme -> "Monochrome"]Prolog (1)
Define a simple graphic to use as a background:
bg = Graphics[Polygon[{{0, 0}, {1, 0}, {1, 1}, {0, 1}}, VertexColors -> {Orange, Orange, White, White}], AspectRatio -> Full];Use it in multiple mesh regions:
ConvexHullRegion[Triangle[{{0, 1}, {2, 0}, {2, 2}}], Prolog -> Inset[bg, Scaled[{0, 0}], Scaled[{0, 0}]]]ConvexHullRegion[Line[{{0, 0}, {1, 0}, {2, 1 / 2}, {2, -1 / 2}, {1, 0}}], Prolog -> Inset[bg, Scaled[{0, 0}], Scaled[{0, 0}]]]RotateLabel (2)
Specify that vertical frame labels should be rotated:
ConvexHullRegion[Triangle[{{0, 1}, {2, 0}, {2, 2}}], Frame -> True, FrameLabel -> {None, "y axis"}, RotateLabel -> True]Specify that vertical frame labels should not be rotated:
ConvexHullRegion[Triangle[{{0, 1}, {2, 0}, {2, 2}}], Frame -> True, FrameLabel -> {None, "y axis"}, RotateLabel -> False]SphericalRegion (2)
Make a sequence of images be consistently sized, independent of orientation:
Table[ConvexHullRegion[Pyramid[{{0, 0, 0}, {2, 0, 0}, {2, 2, 0}, {0, 2, 0}, {1, 1, 2}}], SphericalRegion -> True, ImageSize -> 80, ViewPoint -> 3.{ Sin[t], Cos[t], 1}], {t, 0, 4}]Without SphericalRegion, each image is made as big as possible:
Table[ConvexHullRegion[Pyramid[{{0, 0, 0}, {2, 0, 0}, {2, 2, 0}, {0, 2, 0}, {1, 1, 2}}], ImageSize -> 80, ViewPoint -> 3.{ Sin[t], Cos[t], 1}], {t, 0, 4}]Ticks (3)
Draw the axes but no tick marks:
ConvexHullRegion[Triangle[{{0, 1}, {2, 0}, {2, 2}}], Axes -> True, Ticks -> None]Place tick marks automatically:
ConvexHullRegion[Triangle[{{0, 1}, {2, 0}, {2, 2}}], Axes -> True, Ticks -> Automatic]Draw tick marks at specific positions:
ConvexHullRegion[Triangle[{{0, 1}, {2, 0}, {2, 2}}], Ticks -> {{1, 2, 3}, {1, 3}}, Axes -> True]TicksStyle (2)
Specify the styles of the ticks and tick labels:
ConvexHullRegion[Triangle[{{0, 1}, {2, 0}, {2, 2}}], Ticks -> {{1, 2, 3}, {1, 3}}, Axes -> True, TicksStyle -> Directive[Red, Bold]]Specify the styles of ![]() and
and ![]() axis ticks separately:
axis ticks separately:
ConvexHullRegion[Triangle[{{0, 1}, {2, 0}, {2, 2}}], Axes -> True, TicksStyle -> {Directive[Red, Bold], Directive[Blue, 12]}]ViewAngle (1)
ViewCenter (1)
ViewMatrix (1)
Orthographic view of a mesh region from the negative ![]() direction:
direction:
ConvexHullRegion[Pyramid[{{0, 0, 0}, {2, 0, 0}, {2, 2, 0}, {0, 2, 0}, {1, 1, 2}}], ViewMatrix -> {TransformationMatrix[RescalingTransform[{{-1, 1}, {-1, 1}, {-1, 1}}]], {{1, 0, 0, 0}, {0, 1, 0, 0}, {0, 0, -1, 0}, {0, 0, 0, 1}}}]ViewPoint (3)
Specify the view point using the special scaled coordinates:
ConvexHullRegion[Pyramid[{{0, 0, 0}, {2, 0, 0}, {2, 2, 0}, {0, 2, 0}, {1, 1, 2}}], ViewPoint -> {Pi, Pi / 2, 2}]{ConvexHullRegion[Pyramid[{{0, 0, 0}, {2, 0, 0}, {2, 2, 0}, {0, 2, 0}, {1, 1, 2}}], ViewPoint -> Front],
Region[Pyramid[{{0, 0, 0}, {2, 0, 0}, {2, 2, 0}, {0, 2, 0}, {1, 1, 2}}], ViewPoint -> Top]}{ConvexHullRegion[Pyramid[{{0, 0, 0}, {2, 0, 0}, {2, 2, 0}, {0, 2, 0}, {1, 1, 2}}], ViewPoint -> {0, -Infinity, 0}],
Region[Pyramid[{{0, 0, 0}, {2, 0, 0}, {2, 2, 0}, {0, 2, 0}, {1, 1, 2}}], ViewPoint -> {0, 0, Infinity}]}ViewProjection (1)
ViewRange (2)
By default, the range is sufficient to include all the objects:
ConvexHullRegion[Pyramid[{{0, 0, 0}, {2, 0, 0}, {2, 2, 0}, {0, 2, 0}, {1, 1, 2}}], ViewPoint -> {1, 0, 1.5}, SphericalRegion -> True]Specify the minimum and maximum distances from the camera to be included:
ConvexHullRegion[Pyramid[{{0, 0, 0}, {2, 0, 0}, {2, 2, 0}, {0, 2, 0}, {1, 1, 2}}], ViewPoint -> {1, 0, 1.5}, ViewRange -> {3.5, 7.2}, SphericalRegion -> True]ViewVector (1)
ViewVertical (2)
Use the ![]() axis direction as the vertical direction in the final image:
axis direction as the vertical direction in the final image:
ConvexHullRegion[Pyramid[{{0, 0, 0}, {2, 0, 0}, {2, 2, 0}, {0, 2, 0}, {1, 1, 2}}], ViewVertical -> {1, 0, 0}]Various views of vertical directions:
Table[ConvexHullRegion[Pyramid[{{0, 0, 0}, {2, 0, 0}, {2, 2, 0}, {0, 2, 0}, {1, 1, 2}}], ViewVertical -> v], {v, {{1, 0, 1}, {.5, 0, 1}, {0, -.5, 1}, {0, -1, 1}}}]Applications (3)
Create a gallery of basic regions and their convex hull:
Multicolumn[Table[Row[{Region[f, ImageSize -> 30], [image], Region[ConvexHullRegion[f], ImageSize -> 30]}], {f, {...}}], 4, Spacings -> 3]The convex hull of a compound of five tetrahedra is a dodecahedron:
ℛ = DiscretizeGraphics[PolyhedronData["TetrahedronFiveCompound"]]ConvexHullRegion[MeshCoordinates[ℛ]]Compute the convex hull of a cow:
cowPoints = ExampleData[{"Geometry3D", "Cow"}, "VertexData"];cowvexHull = ConvexHullRegion[cowPoints];Visualize convex hull and cow:
cow = ExampleData[{"Geometry3D", "Cow"}, "Graphics3D"];Show[HighlightMesh[cowvexHull, {Style[1, {Brown}], Style[2, Opacity[0.3, Brown]]}], cow]Properties & Relations (4)
ConvexHullRegion from the 2D points is a Polygon:
pts = RandomReal[1, {10, 2}];ℛ = ConvexHullRegion[pts]{BoundedRegionQ[ℛ], RegionBounds[ℛ]}{RegionDimension[ℛ], RegionEmbeddingDimension[ℛ]}Use ConvexRegionQ to check the property of the convex hull region:
ConvexHullRegion[[image]]ConvexRegionQ[%]Use DelaunayMesh to get a Delaunay triangulation of the interior of the convex hull:
DelaunayMesh[RandomReal[1, {25, 2}]]Use TriangulateMesh to control the triangulation of the interior:
ℛ = ConvexHullRegion[RandomReal[1, {25, 2}]];{TriangulateMesh[ℛ], TriangulateMesh[ℛ, MaxCellMeasure -> ∞]}Possible Issues (1)
ConvexHullRegion gives an approximate result when the exact result cannot be computed:
ConvexHullRegion[BooleanRegion[!#1 && #2&, {Cube[{1 / 2, 0, 0}], Ball[]}]]On[General::approx]ConvexHullRegion[BooleanRegion[!#1 && #2&, {Cube[{1 / 2, 0, 0}], Ball[]}]]
Text
Wolfram Research (2020), ConvexHullRegion, Wolfram Language function, https://reference.wolfram.com/language/ref/ConvexHullRegion.html.
CMS
Wolfram Language. 2020. "ConvexHullRegion." Wolfram Language & System Documentation Center. Wolfram Research. https://reference.wolfram.com/language/ref/ConvexHullRegion.html.
APA
Wolfram Language. (2020). ConvexHullRegion. Wolfram Language & System Documentation Center. Retrieved from https://reference.wolfram.com/language/ref/ConvexHullRegion.html